Case Studies
Airspeed Sensors Confirming Gas Mixing in a Test Chamber
A manufacturer needed to ensure that their test chamber had adequate air mixing and good airflow.
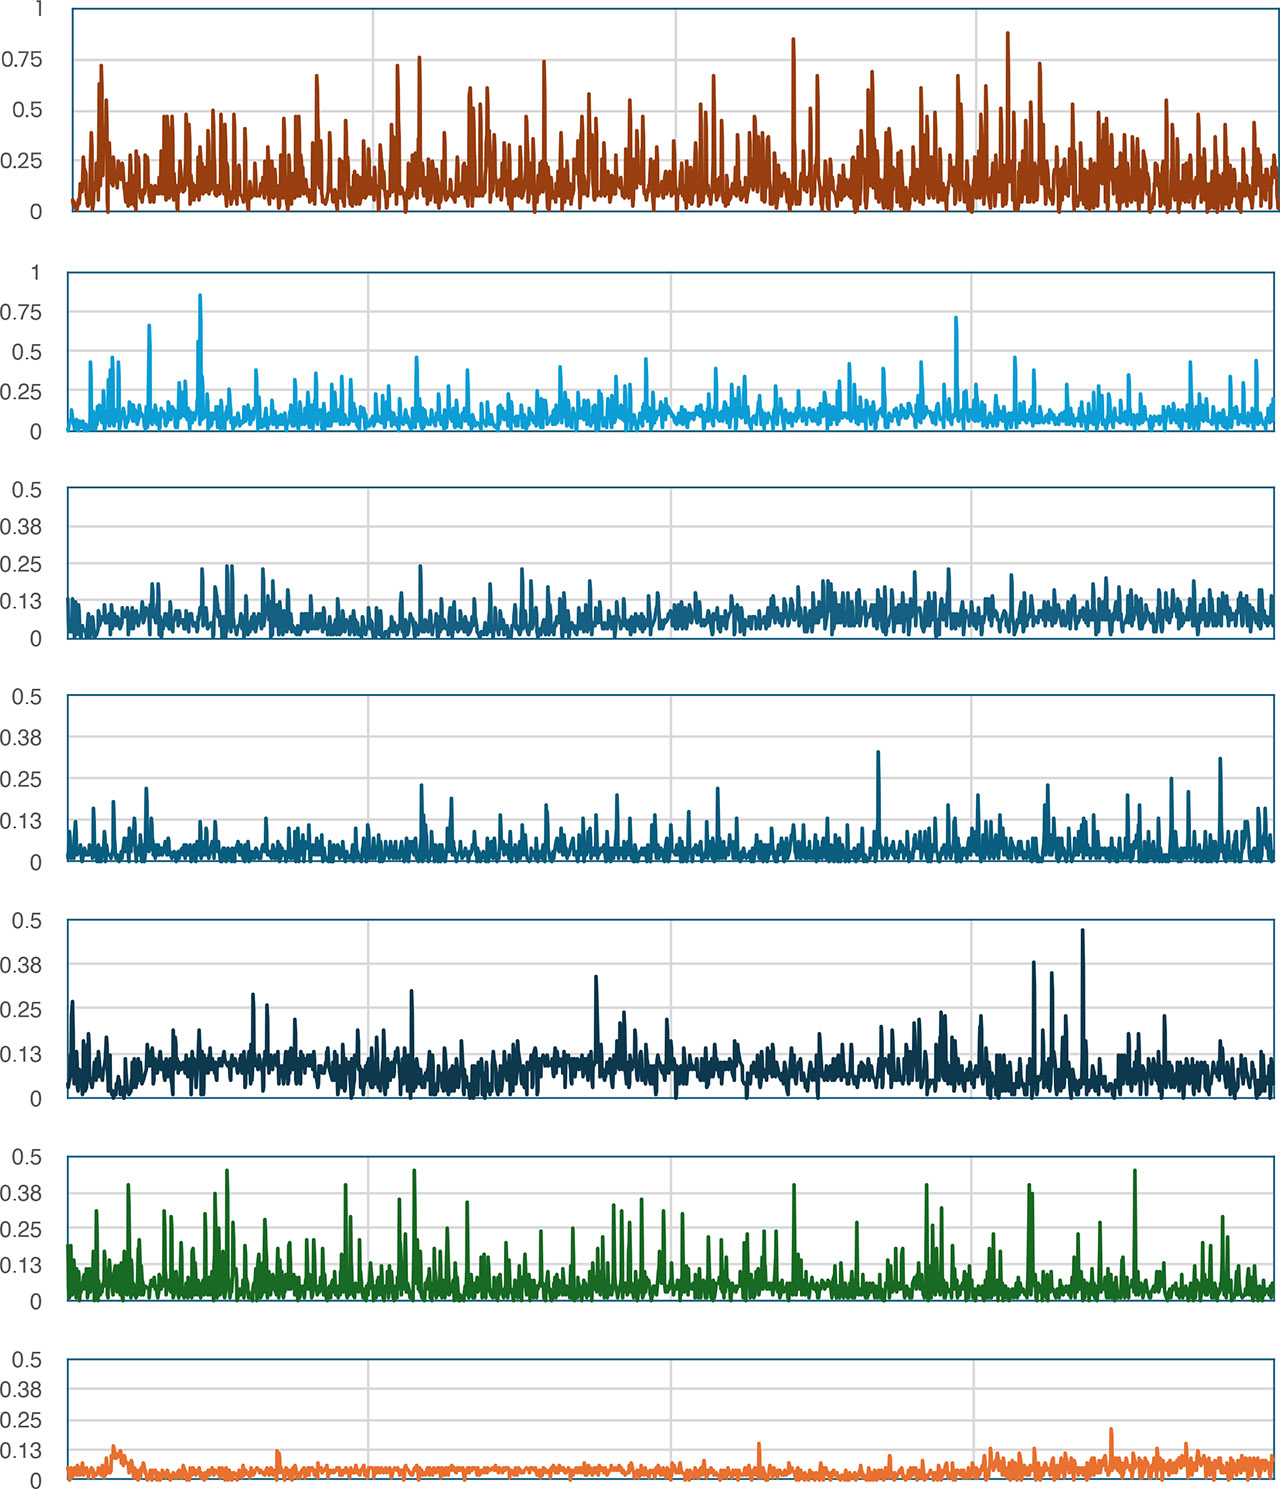
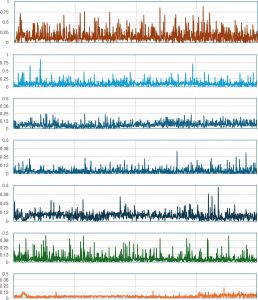
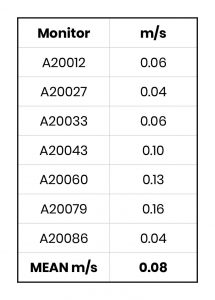
Seven BuiltAir IEQ Monitors were located in various positions in the test chamber to monitor airflow. The Monitors were oriented in the same direction, but the airflow was turbulent with vertical mixing. The X and Y airspeed sensors together allowed us to calculate the vectored airflow and the results are below.
The airflow was variable, but within requirements; however, one location showed a dead spot, which was then subsequently corrected.
The use of networked airflow sensors allowed the manufacturer to rapidly check a critical test facility. The entire test time was less than two hours and analysis was simple because the sensors were synchronised and the BuiltAir Cloud automatically provided formatted data for easily analysis.
The results of the mean airspeed at each of the seven locations are summarised below.
Monitoring Noise Levels at a Music Festival
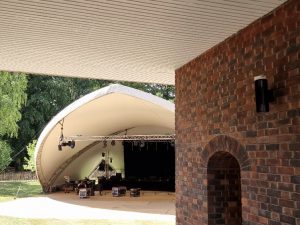 Most cities have strict requirements on noise levels at music festivals, with noise restrictions after specific times, such as 11:00PM or midnight. Portable noise meters are often used by the local authority to ensure compliance, but what is needed is continuous recording, and the distance from the stage is important. A forgotten issue is whether to record dBA or dBC, especially relevant to rock music which often has significant low frequency bass content, which increases dBC more than dBA.
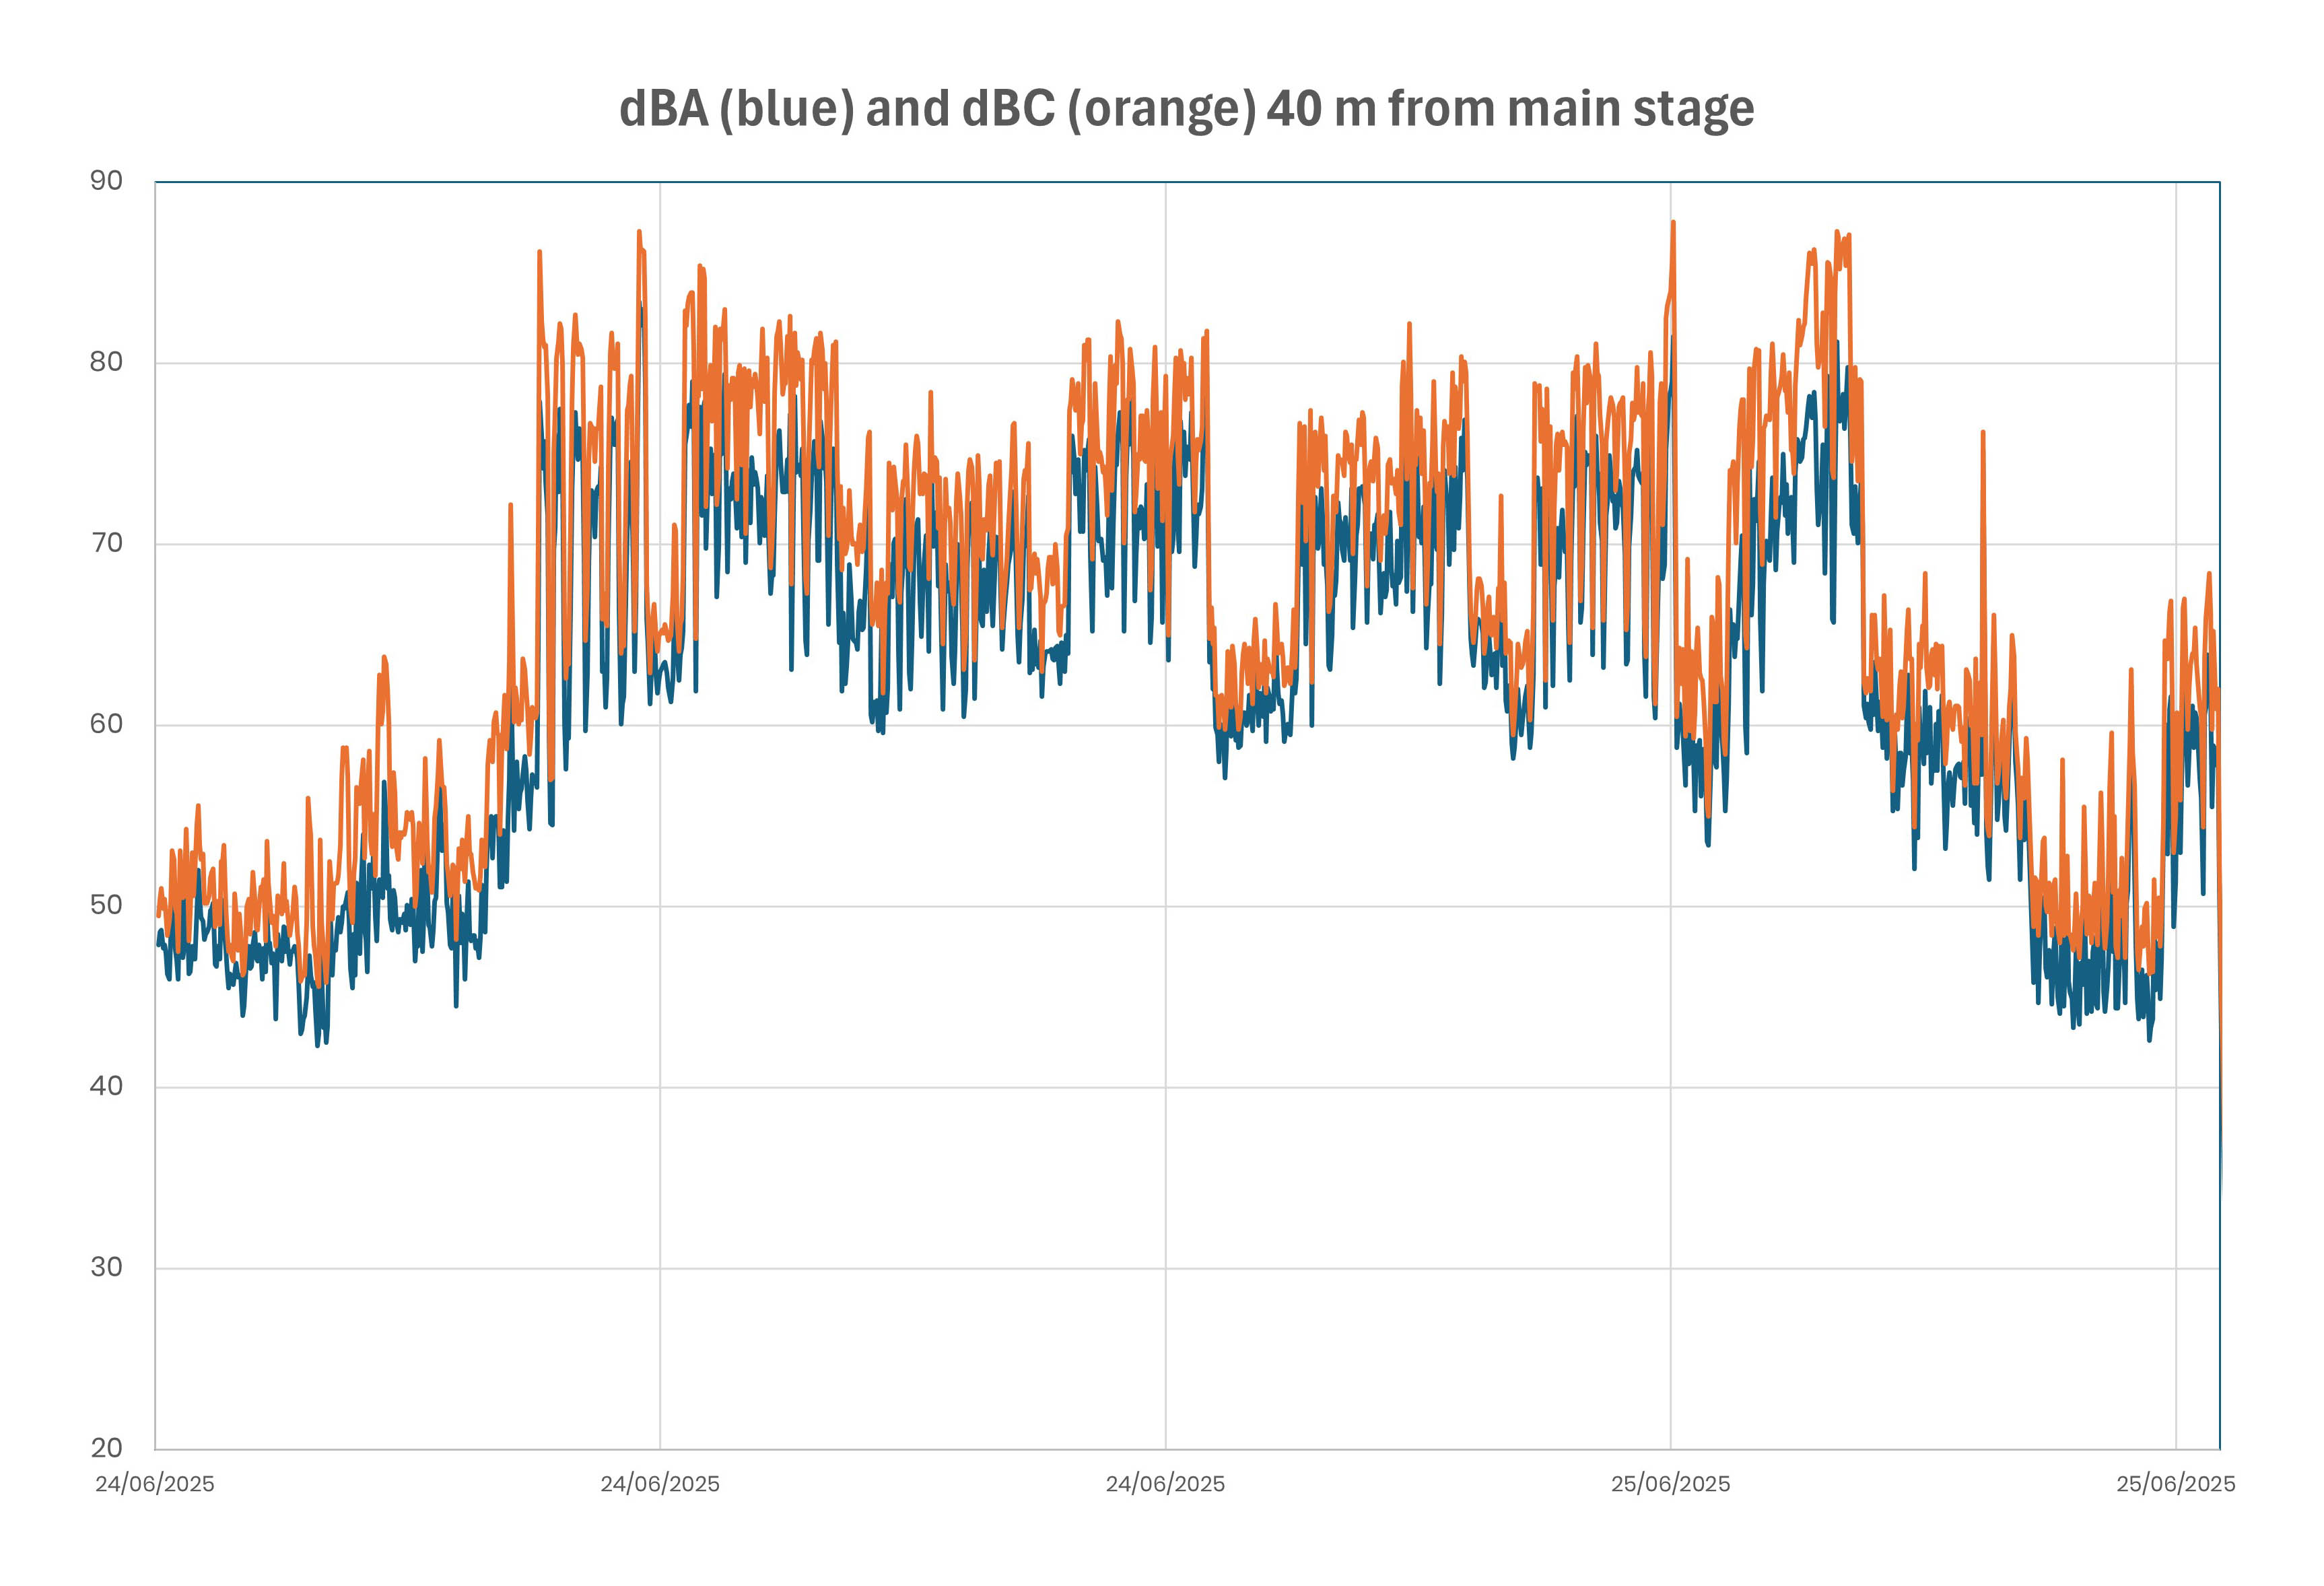
The noise level was monitored at an overnight festival using three BuiltAir IEQ Monitors: one was close to the main stage, a second was further away but near a second stage, and the third was 200m from the main stage, reflecting what neighbours would hear.
In the first time plot we can see the noise level for each band, one band came close to the 80 dBA requirement in the early morning and the previous band finished at quite a high dB level. The bass content was quite significant, adding about 5 dB to the measured sound level. The time axis has been purposely anonymised.
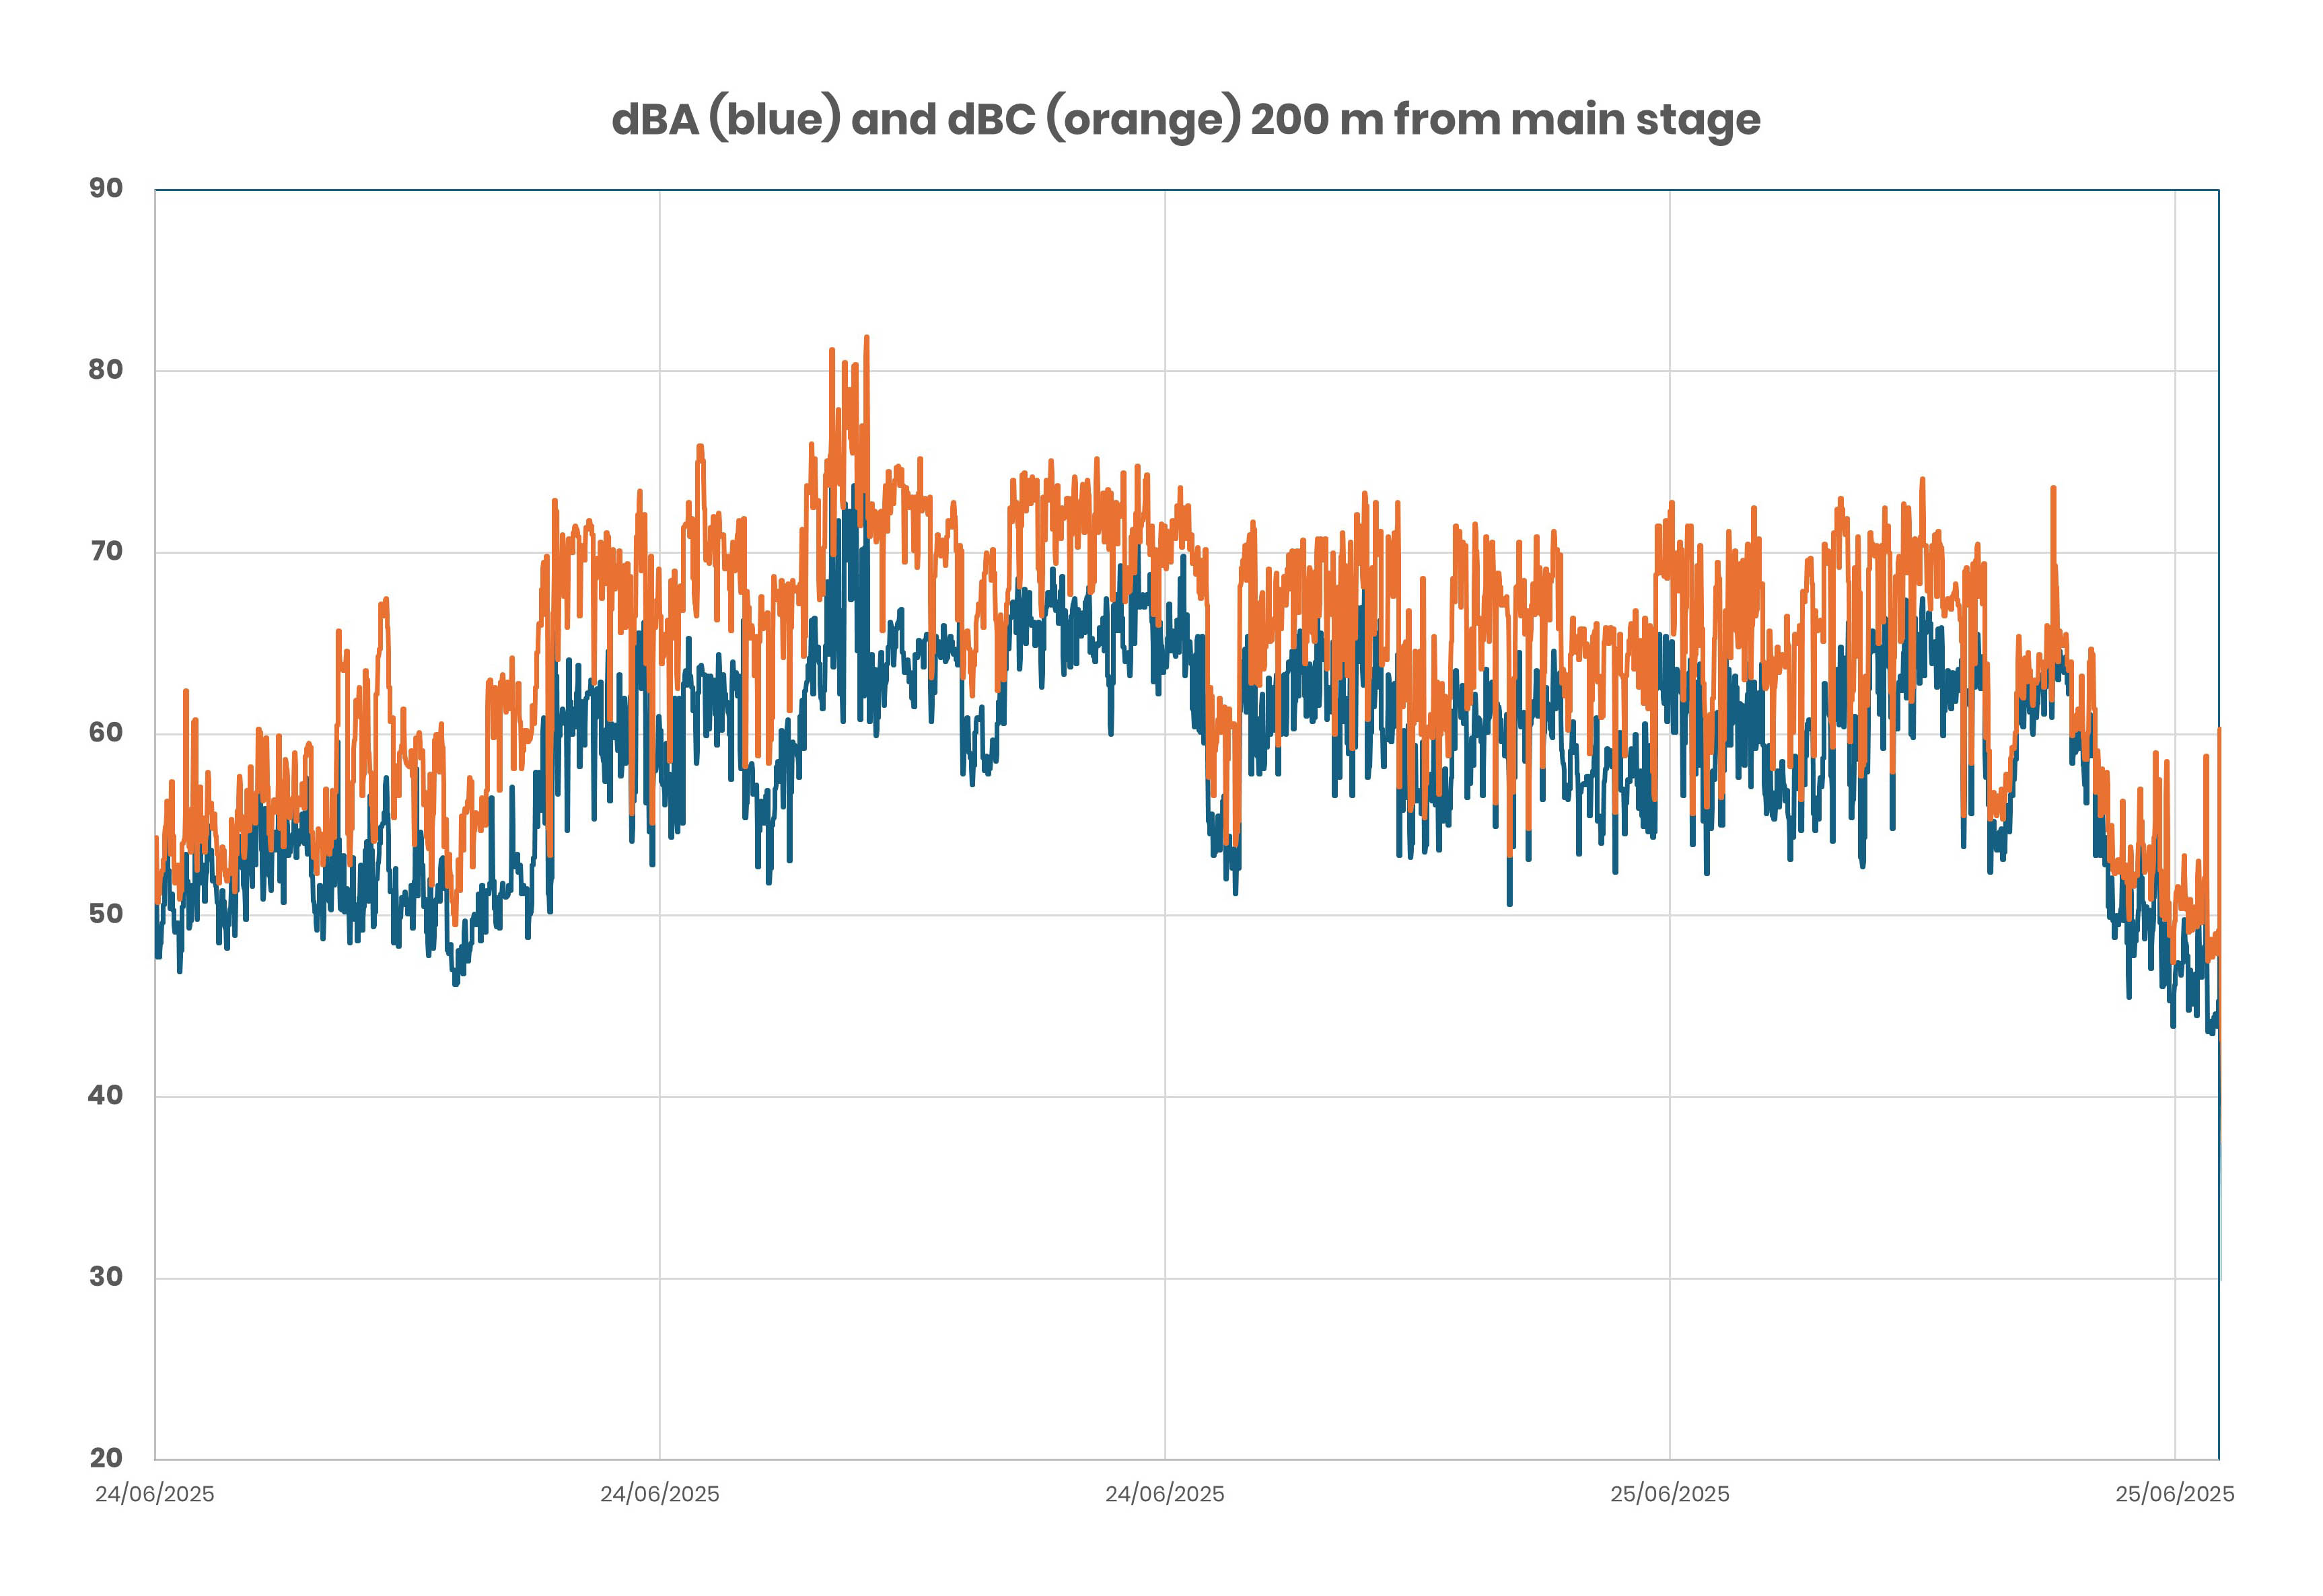
The noise level 200 m away (third plot) showed how the lower frequencies travel further; the difference between dBC and dBA is more pronounced. And the noise level was more constant, not showing the significant noise drops between bands. The late night average noise level of 65 dBA was acceptable.
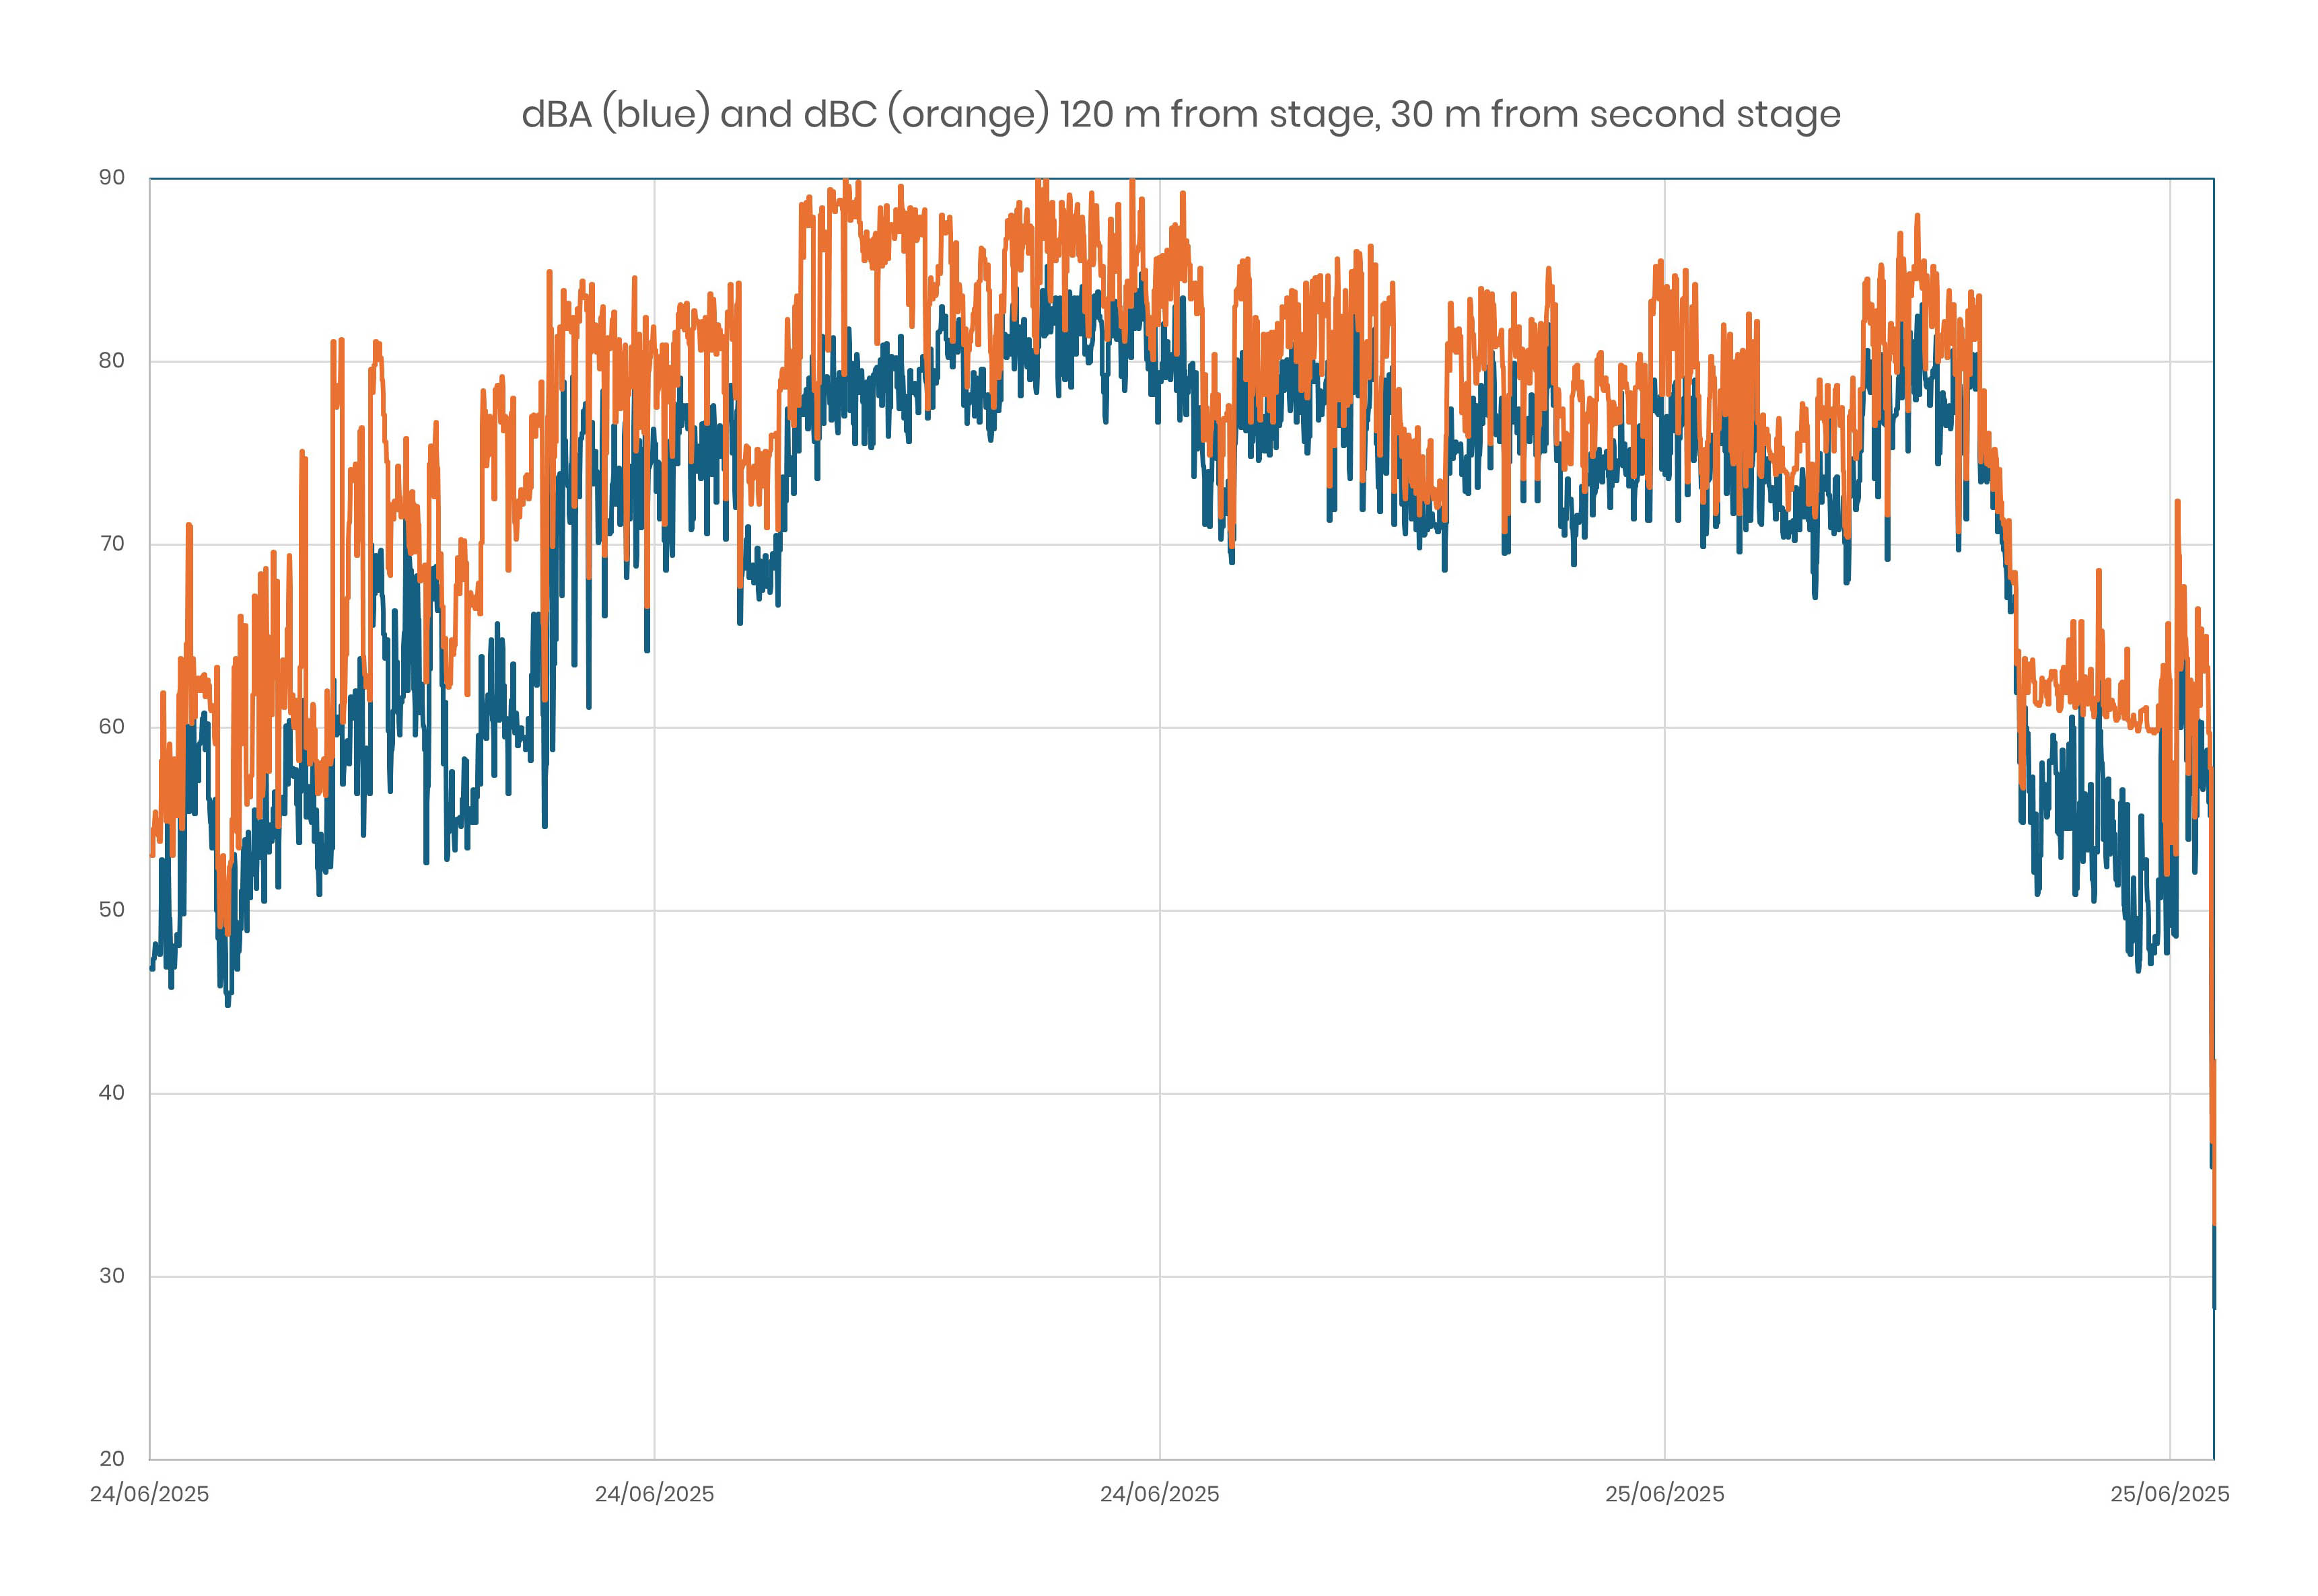
The second plot was more complex because it was a combination of the main stage and a closer second stage. Just like the main stage, the noise level dropped after the curfew hour. The DBC-dBA difference exceeded 10 dB, quite significant, just before curfew.
This network of BuiltAir IEQ Monitors, battery powered and with a massive on-board memory, did not require Wi-fi connection; deployment took seconds, yet the monitors operated as a network, but without cloud connection- another example of the flexibility of the BuiltAir IEQ Monitor.
Measuring Radiant Heat
Thermal comfort is affected by both the anbient temperature and relative humidity. But radiant energy also affects our thermal comfort- that is why we prefer the shade on a sunny day and cars get very hot when parked in the sun.
The BuiltAir IEQ Monitor measures two temperatures: the anbient and radiant temperatures. The difference in temperature is the radiant energy, but this temperature difference can be small. Can the BuiltAir IEQ Monitor reliably measure the radiant energy contribution to thermal comfort?
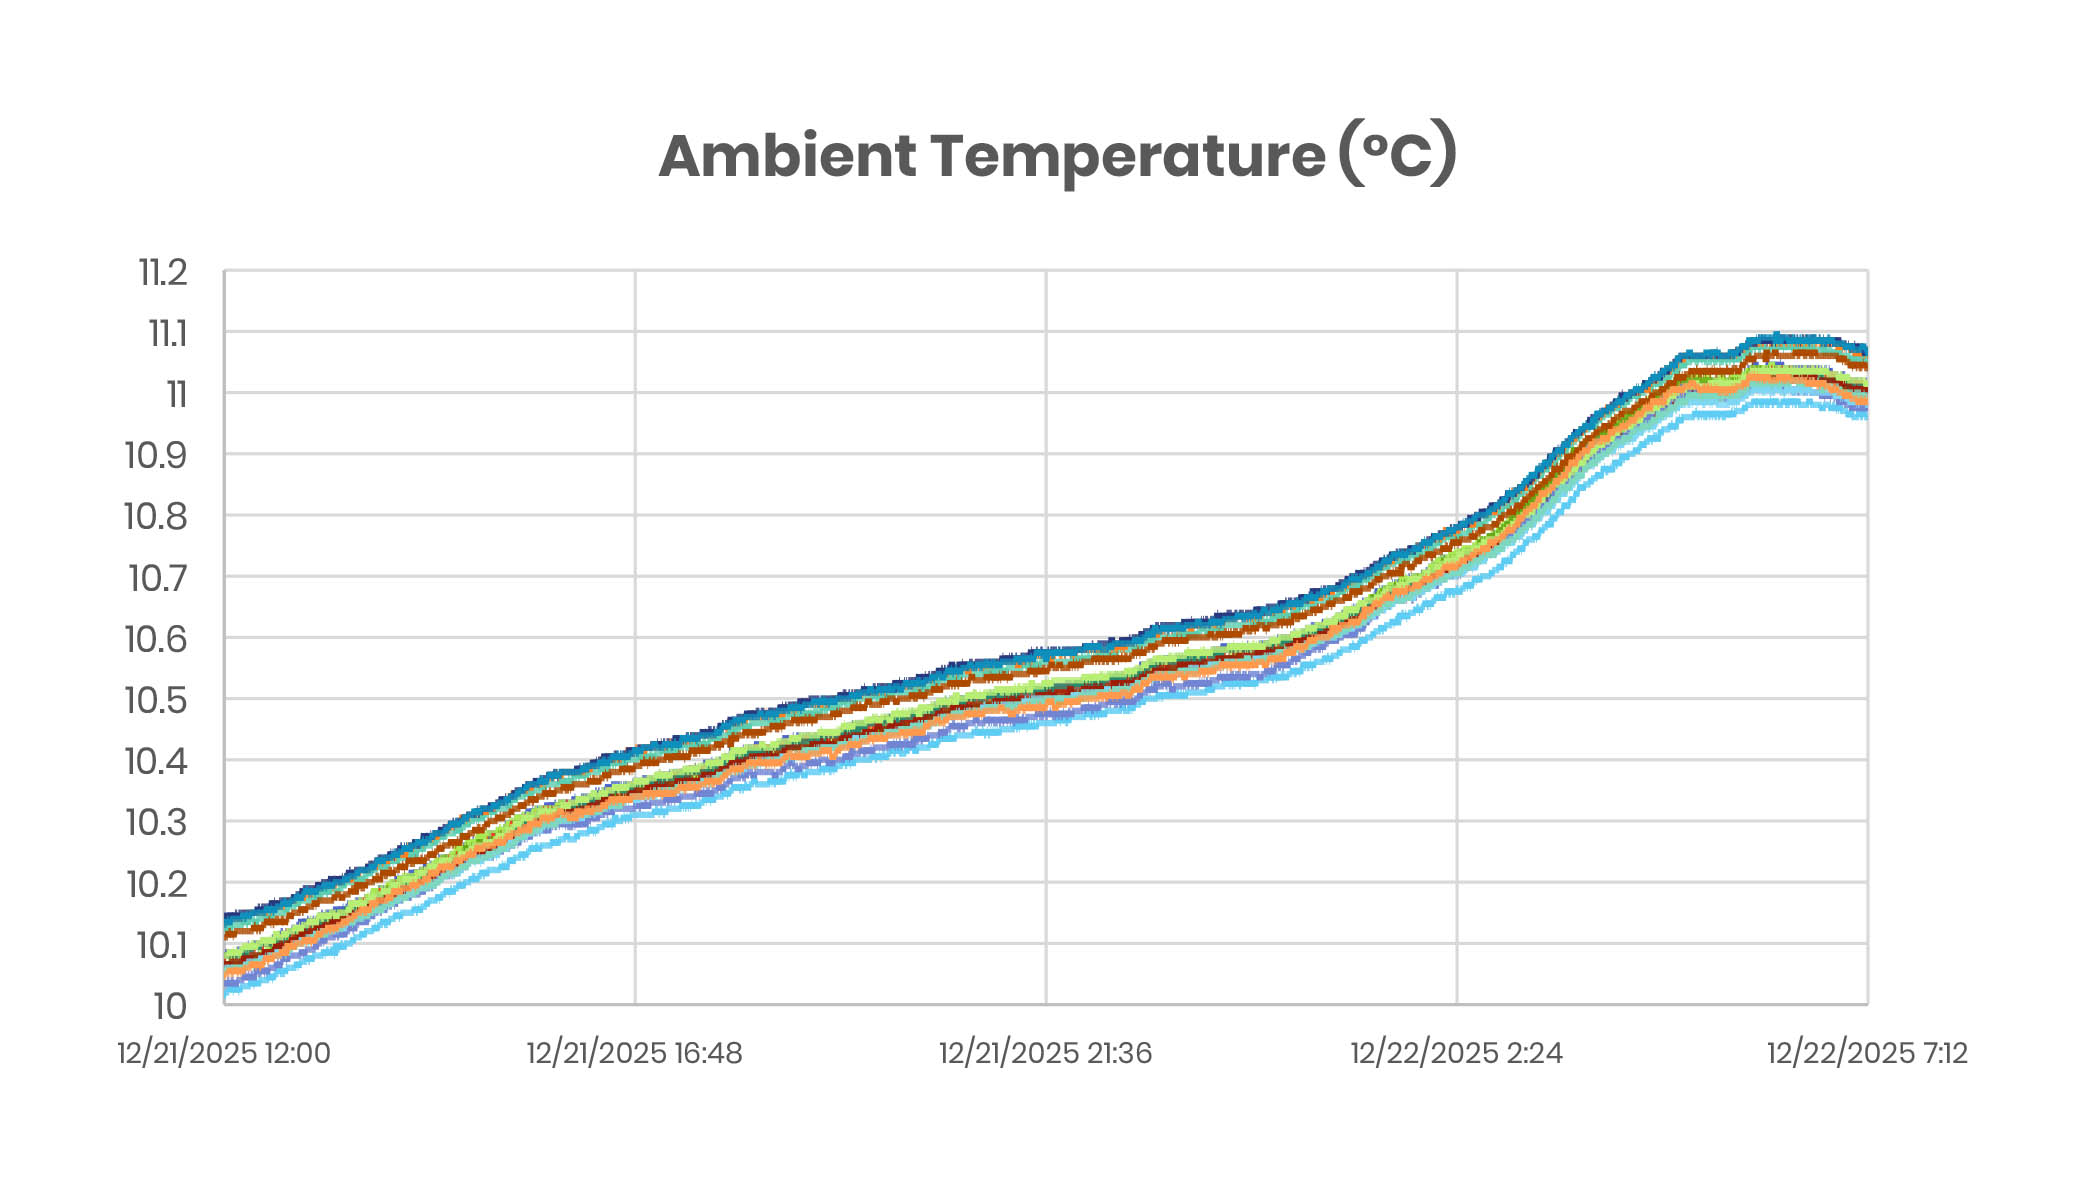
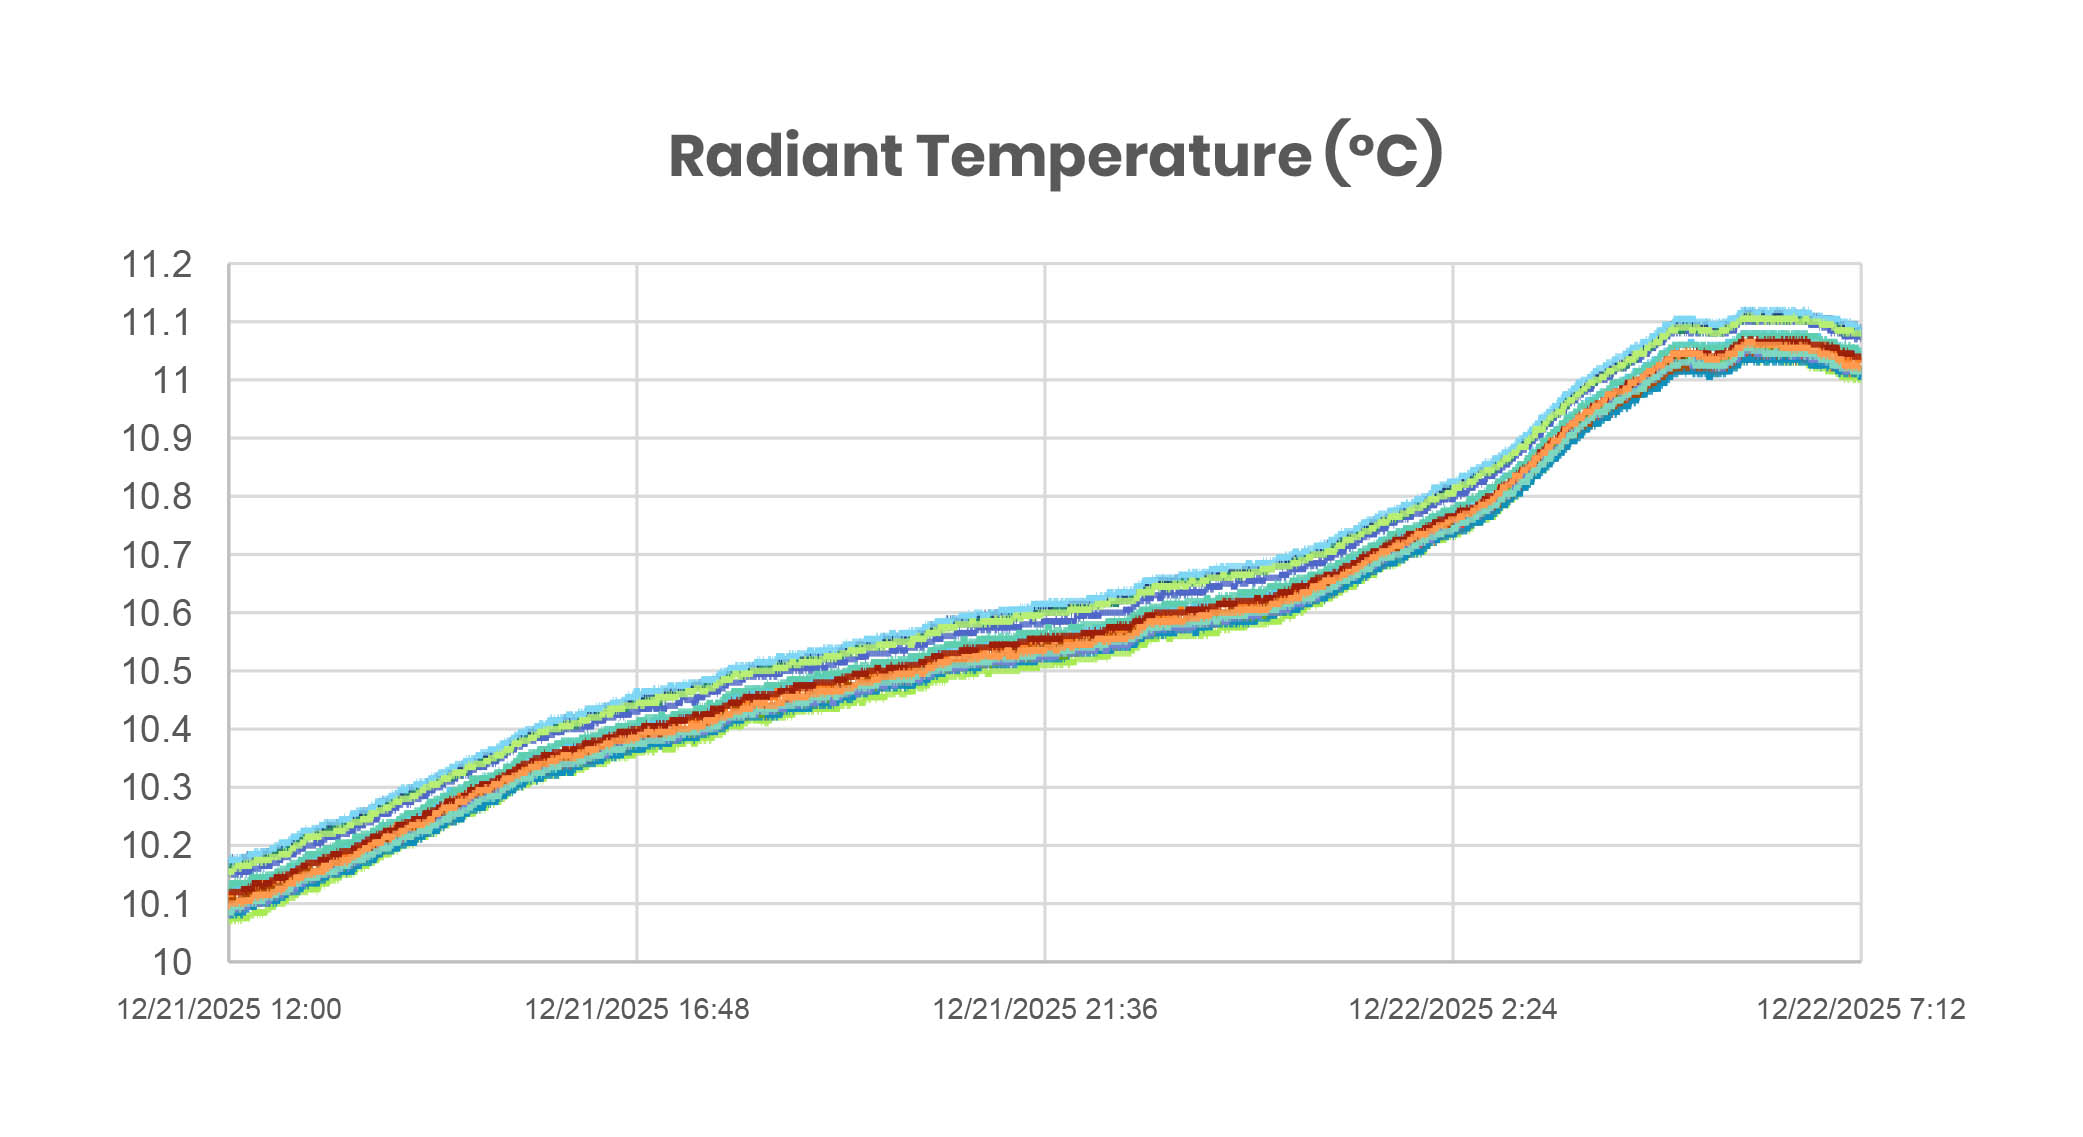
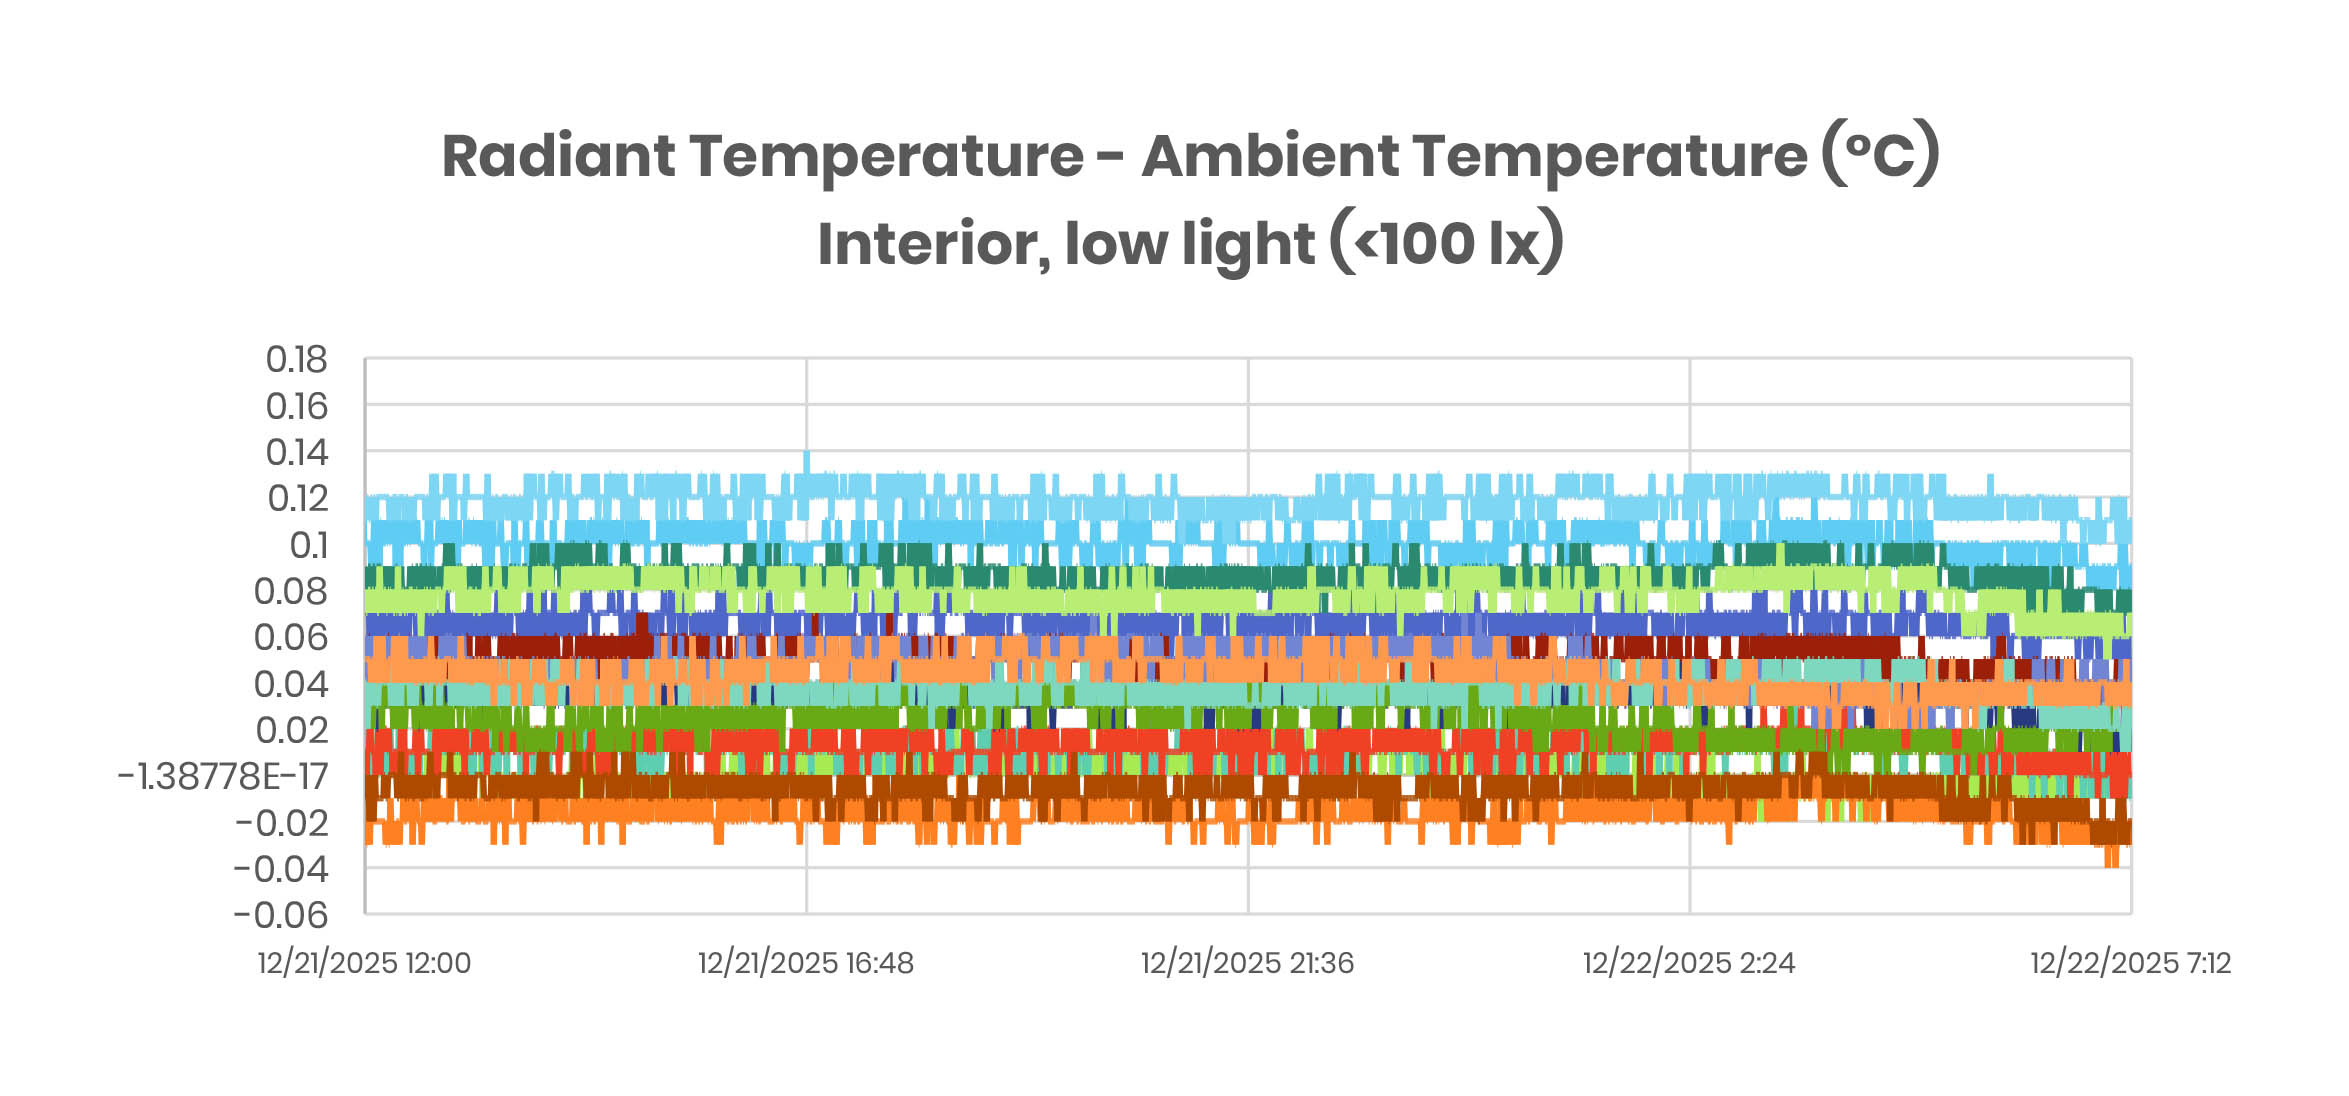
The two plots below show the ambient temperature and radiant temperature for 17 BuiltAir IEQ Monitors. The two plots are very similar, but we should subtract the ambient from the radiant temperature to see the radiant energy contribution – see the third graph.
These results are from a test where the IEQ Monitors were recorded in a low temperature, low light environment with low radiant energy, so with a small temperature difference. Since the IEQ Monitors use very accurate temperature sensors, we see that the calculated radiant energy is actually usefully measured even at these low levels: between -0.02 and 0.12°C. This tight precision means that radiant energy measurements are accurate ±0.06°C.Normal differences for the radiant energy contribution with central heating will be from 0.5 to 5°C.
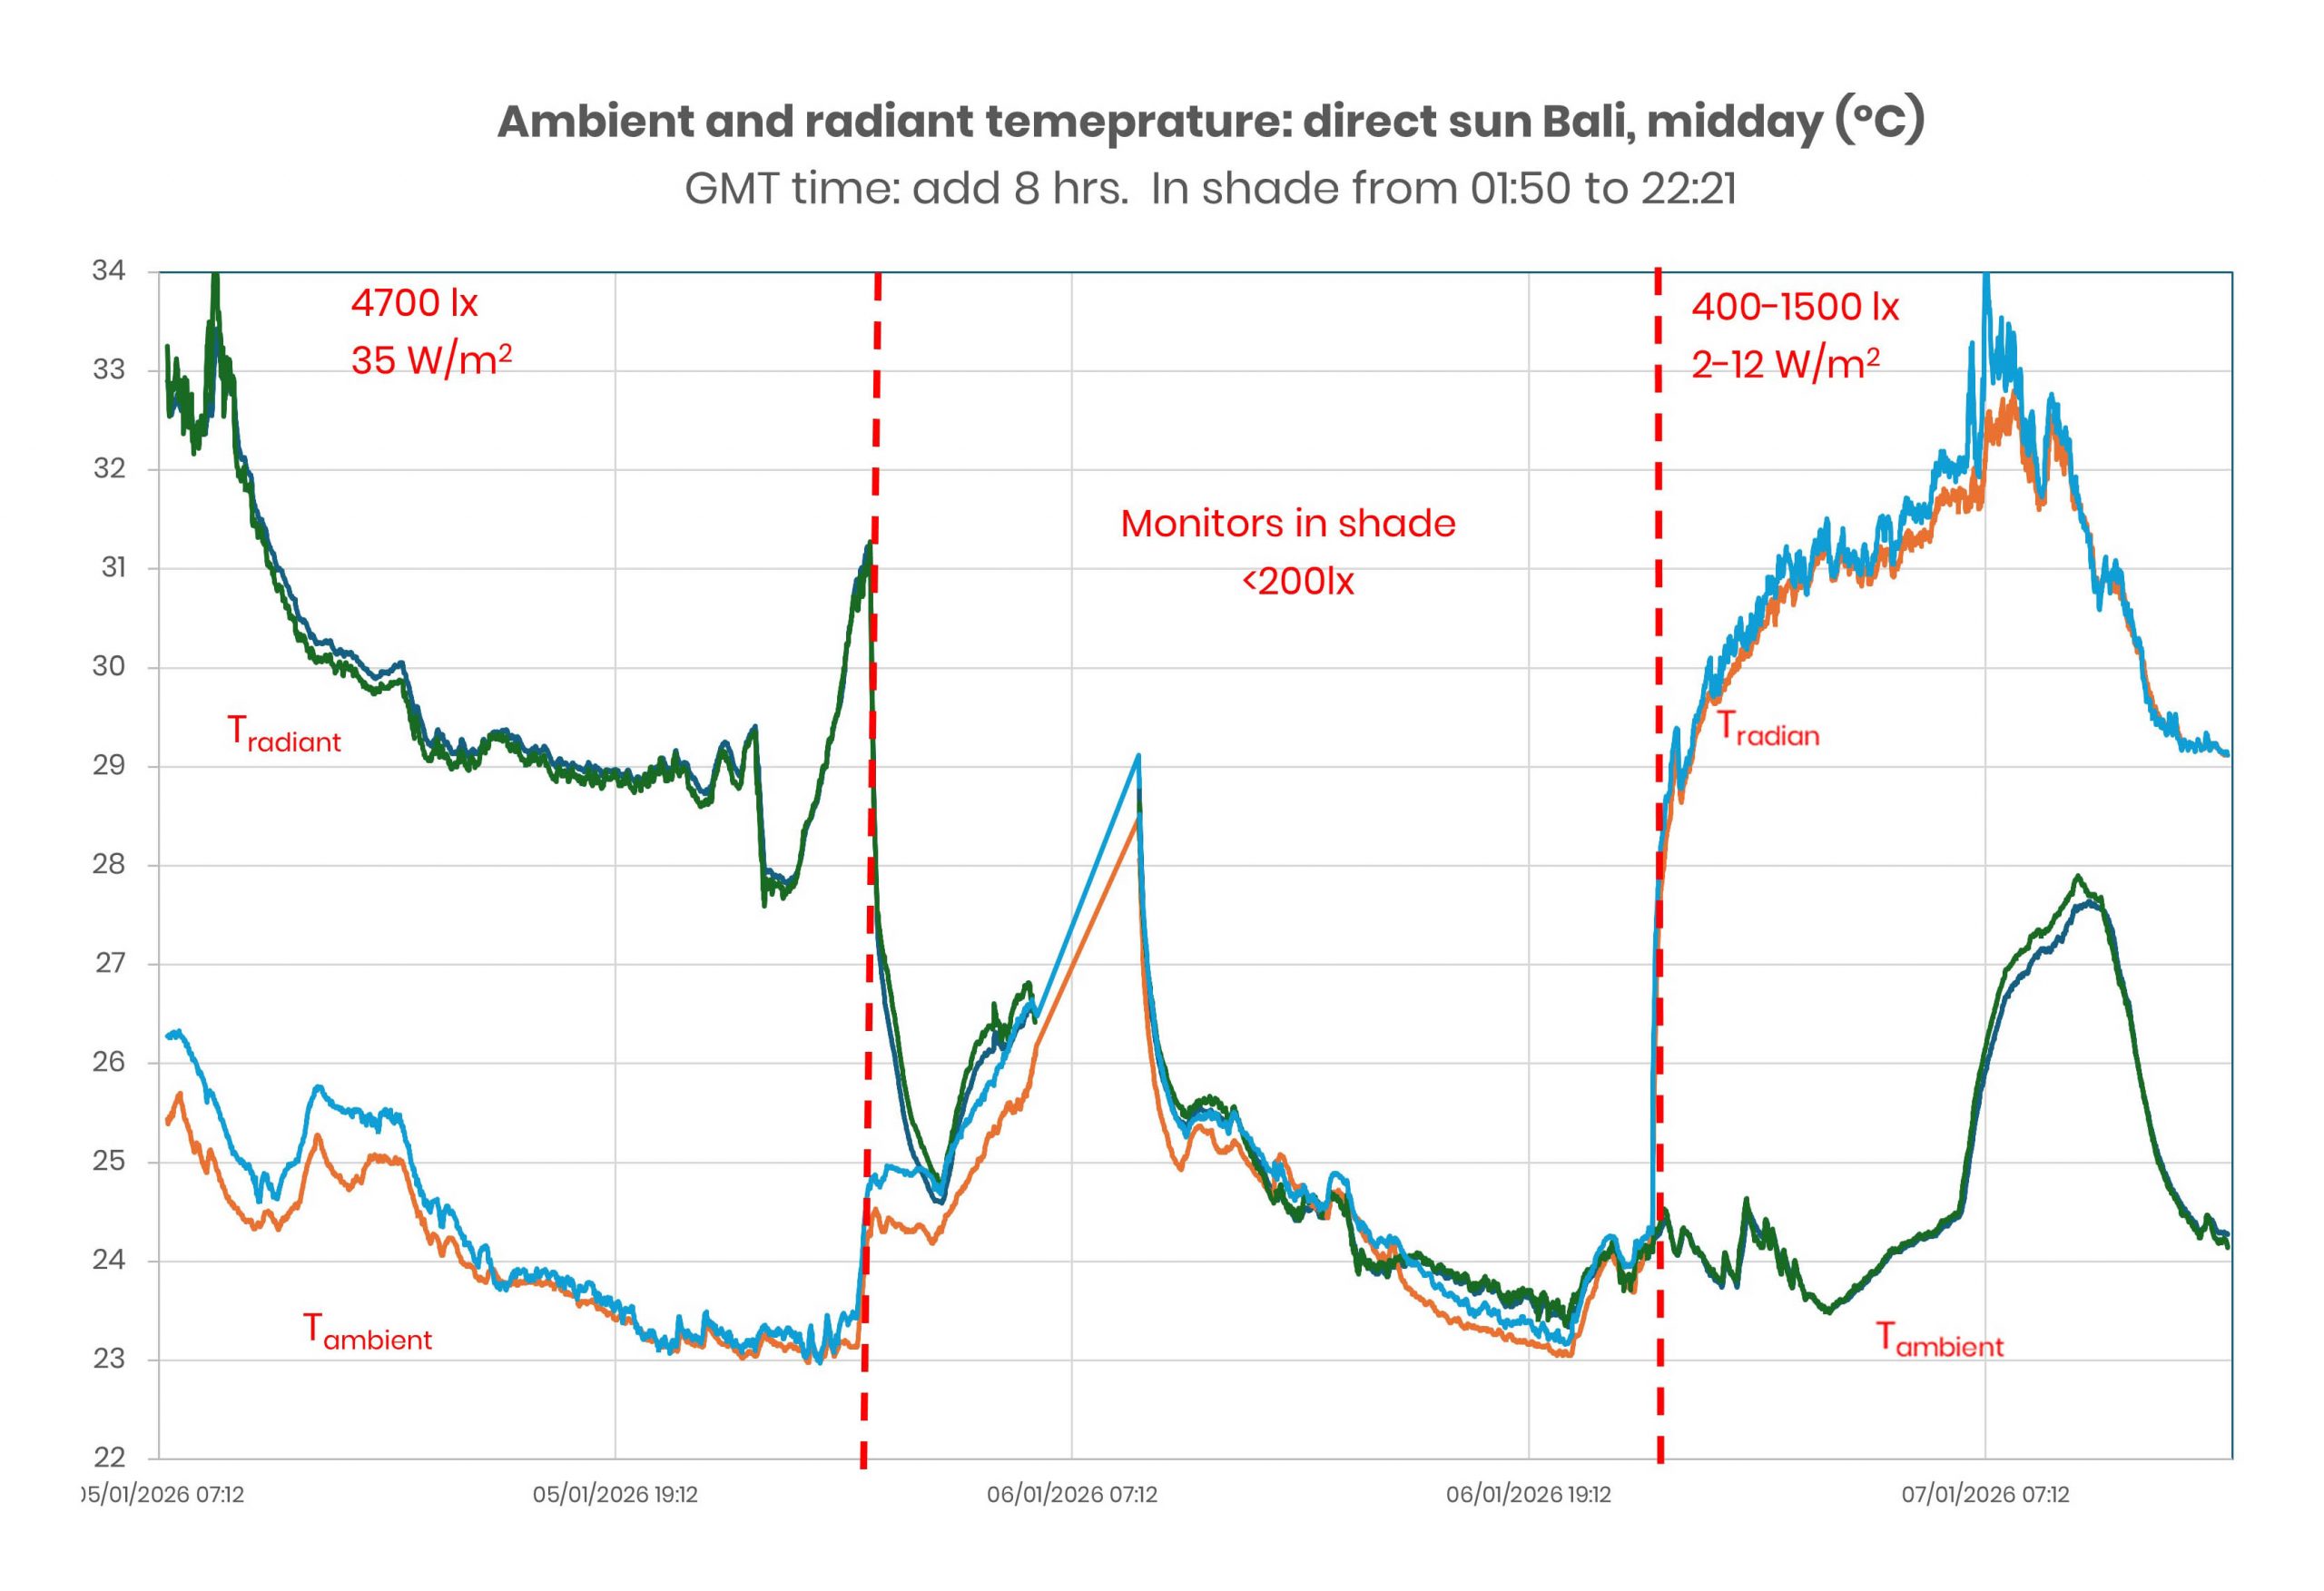
When exposed to direct sunlight, the temperature differences are startling. Measurements near the equator at noontime are shown below. Up to 6ºC temperature differences were recorded.
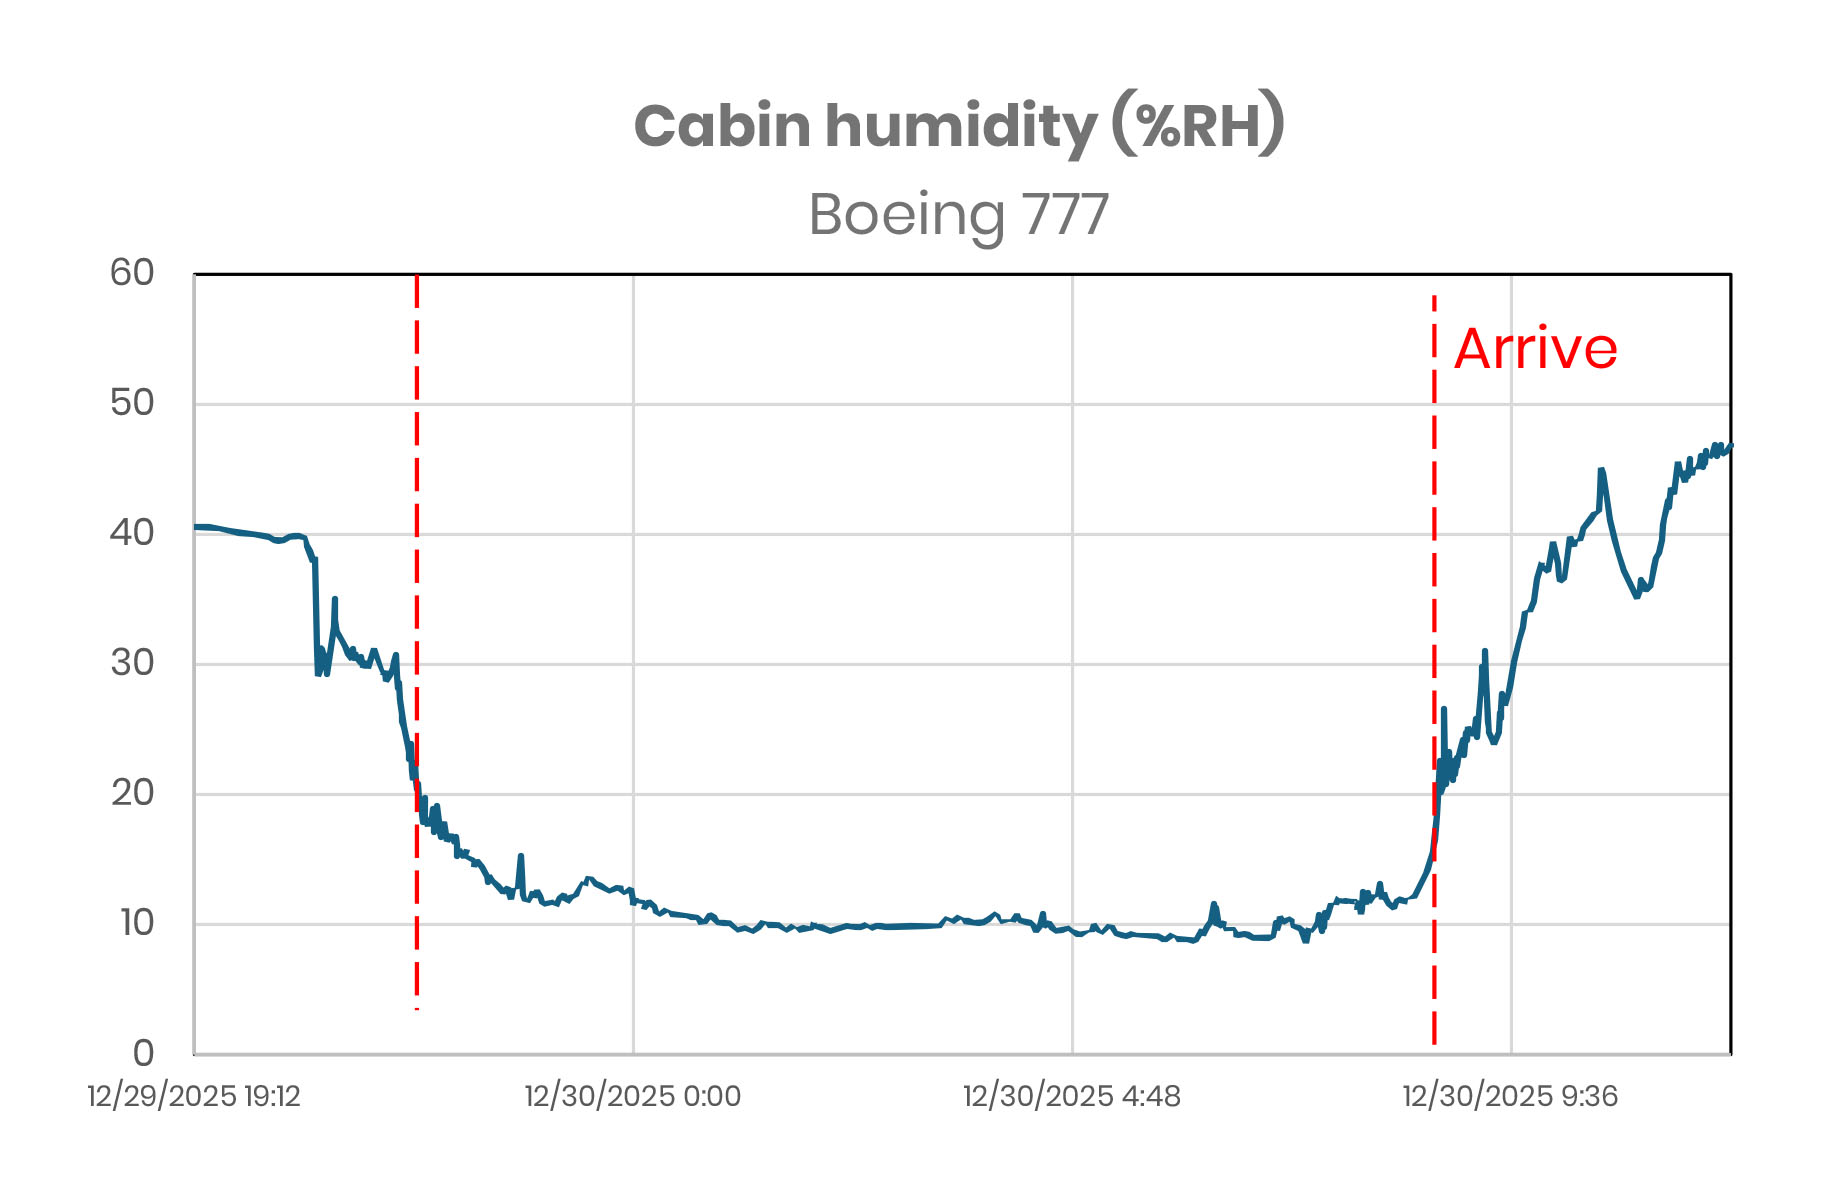
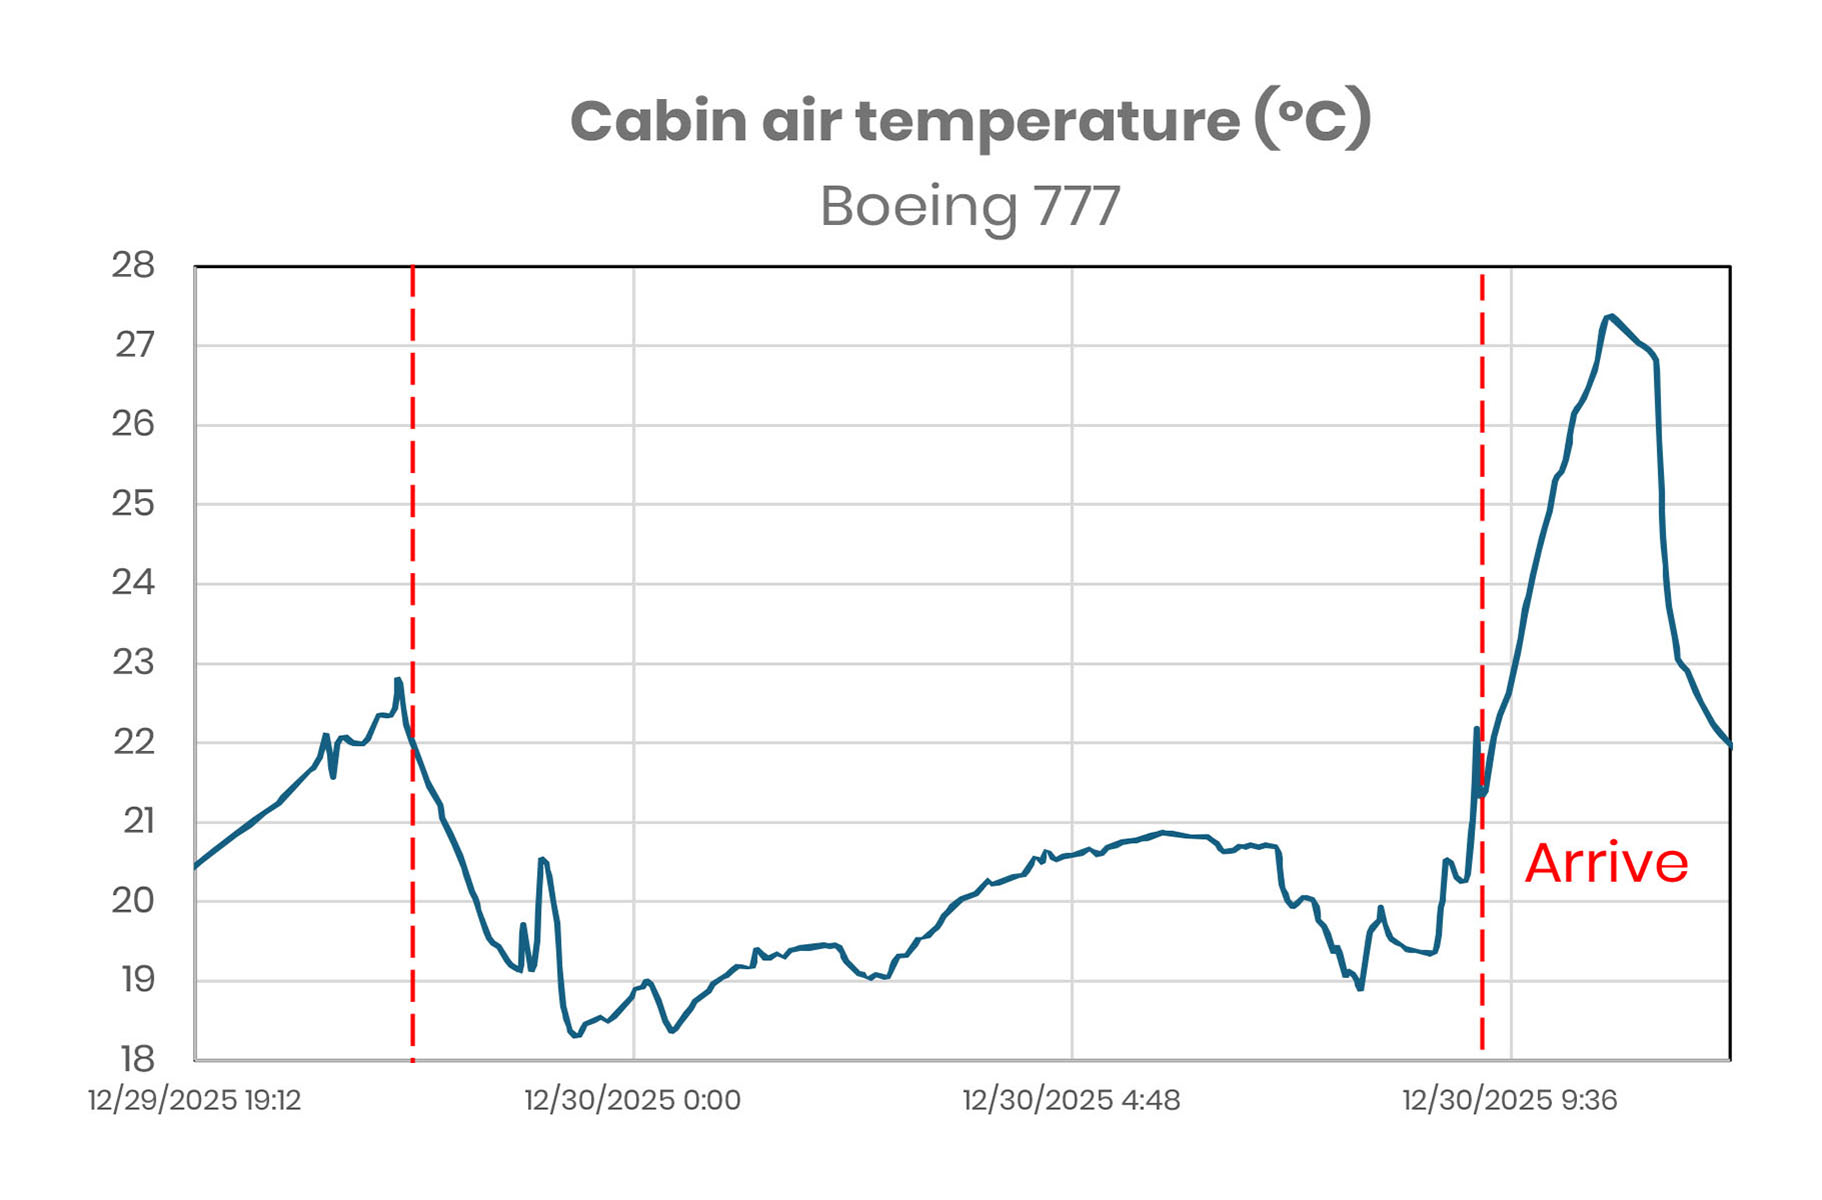
Aircraft cabin environmental conditions
Commercial airlines control cabin pressure, temperature and humidity to ensure our comfort but also to minimise energy usage.
Ventilation and air filtering use at least 5% of the aircraft total energy, so it is a worthy goal to minimise ventilation energy to reduce CO2 emissions. Most aircraft bleed air from the jet engine compressors, but newer aircraft now use inlet air directly, at a greater energy expense, but without potential pollutants from hydraulic oil leakage.
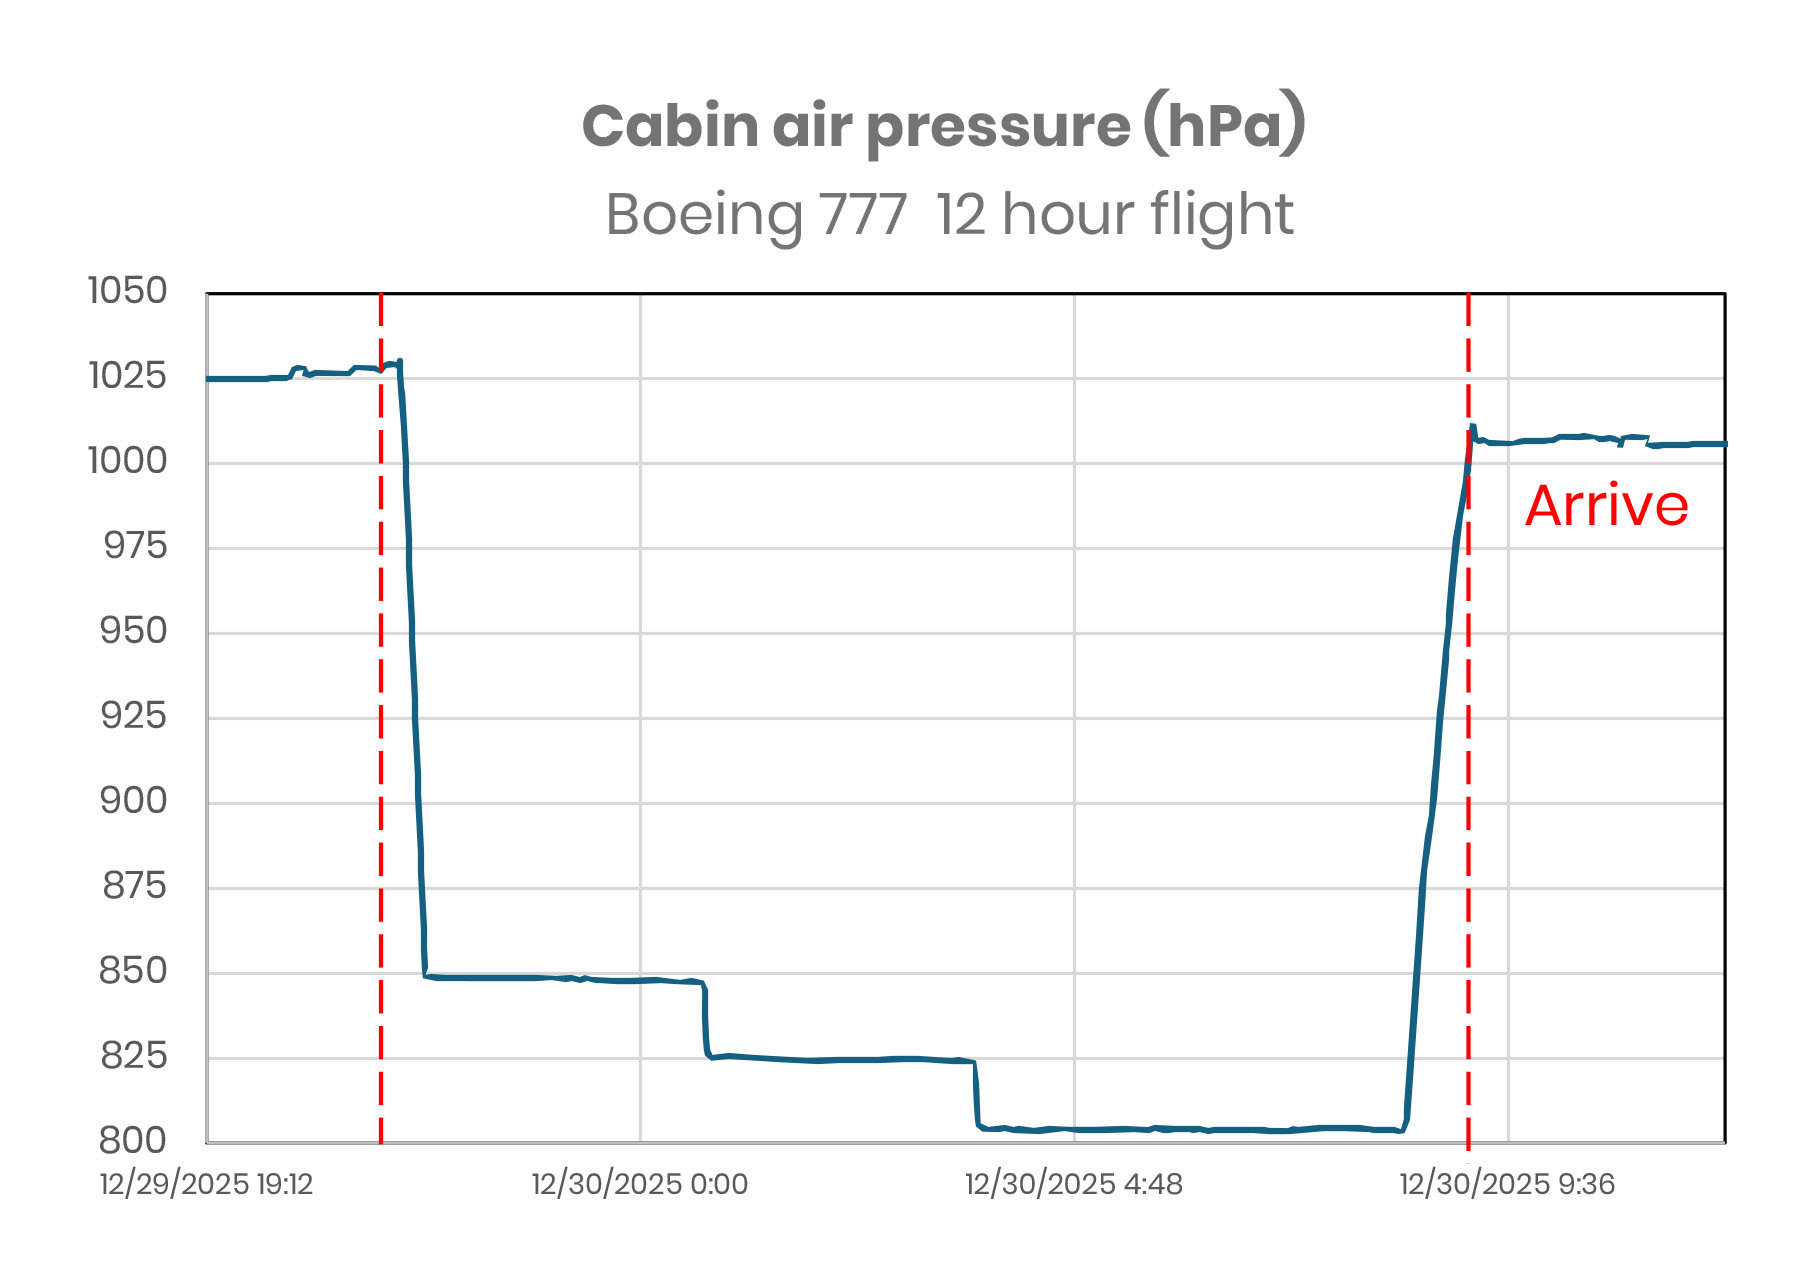
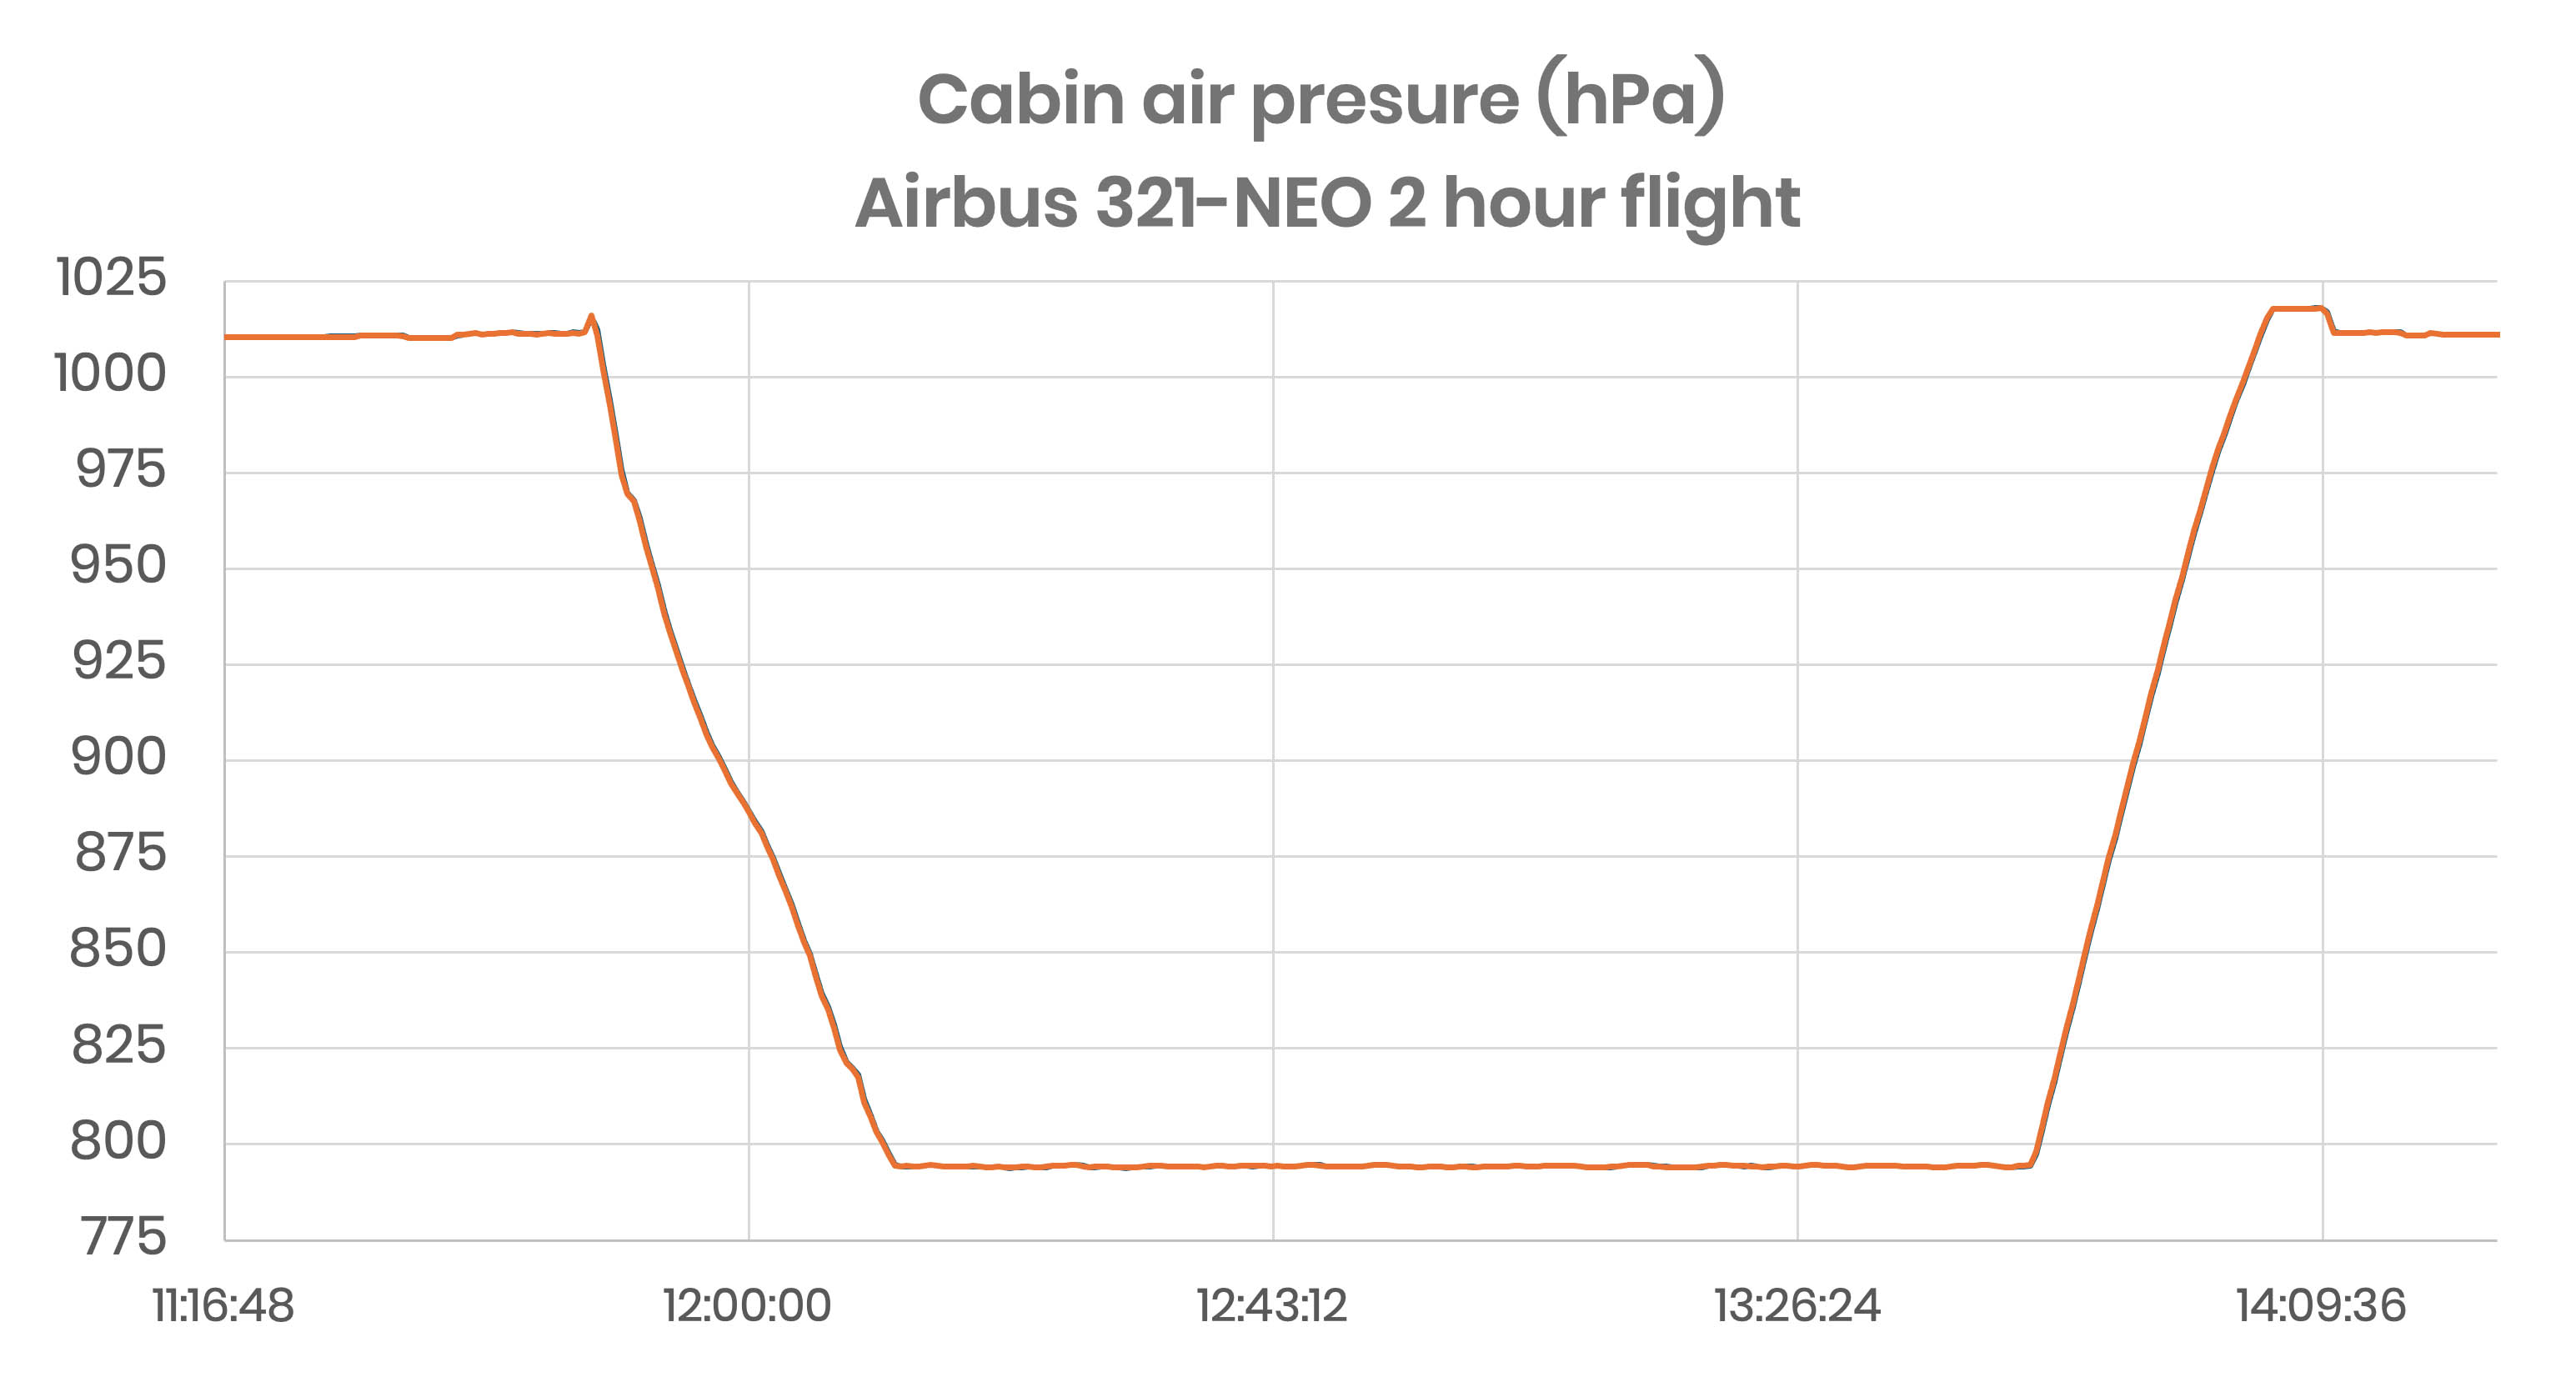
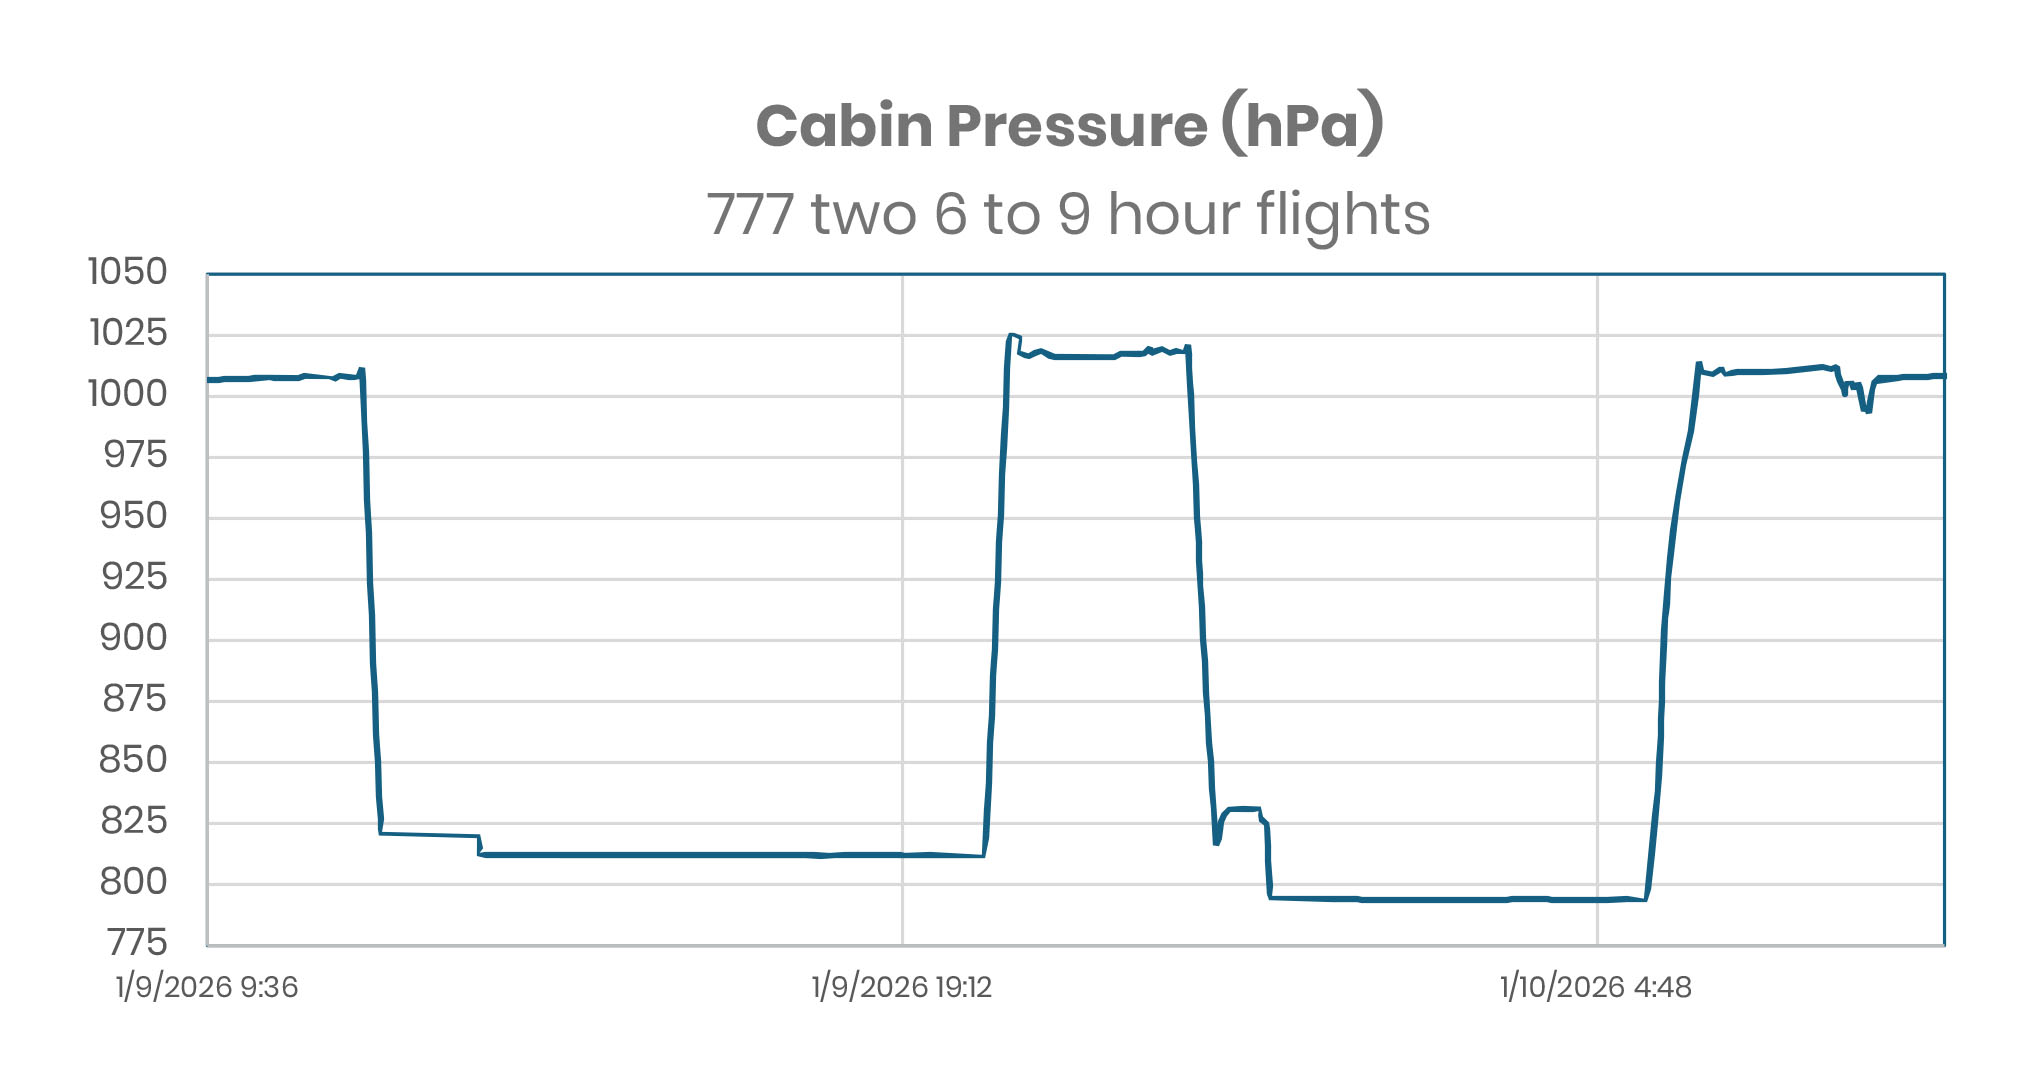
Four recent flights were monitored with two BuiltAir IEQ Monitors.
NOTE: if you wish to record flight information then you must obtain permission from the carrier.
Cabin pressure
Each flight showed very similar pressure-time profiles, reducing cabin pressure from about 1000 hPa (hPa is effectively the same as mbar) to 790 or 800 hPa, One flight went immediately to 790 hPa, while the other three flights held an intermediate pressure of 820 to 850 hPa before reducing cabin pressure to about 800 hPa.
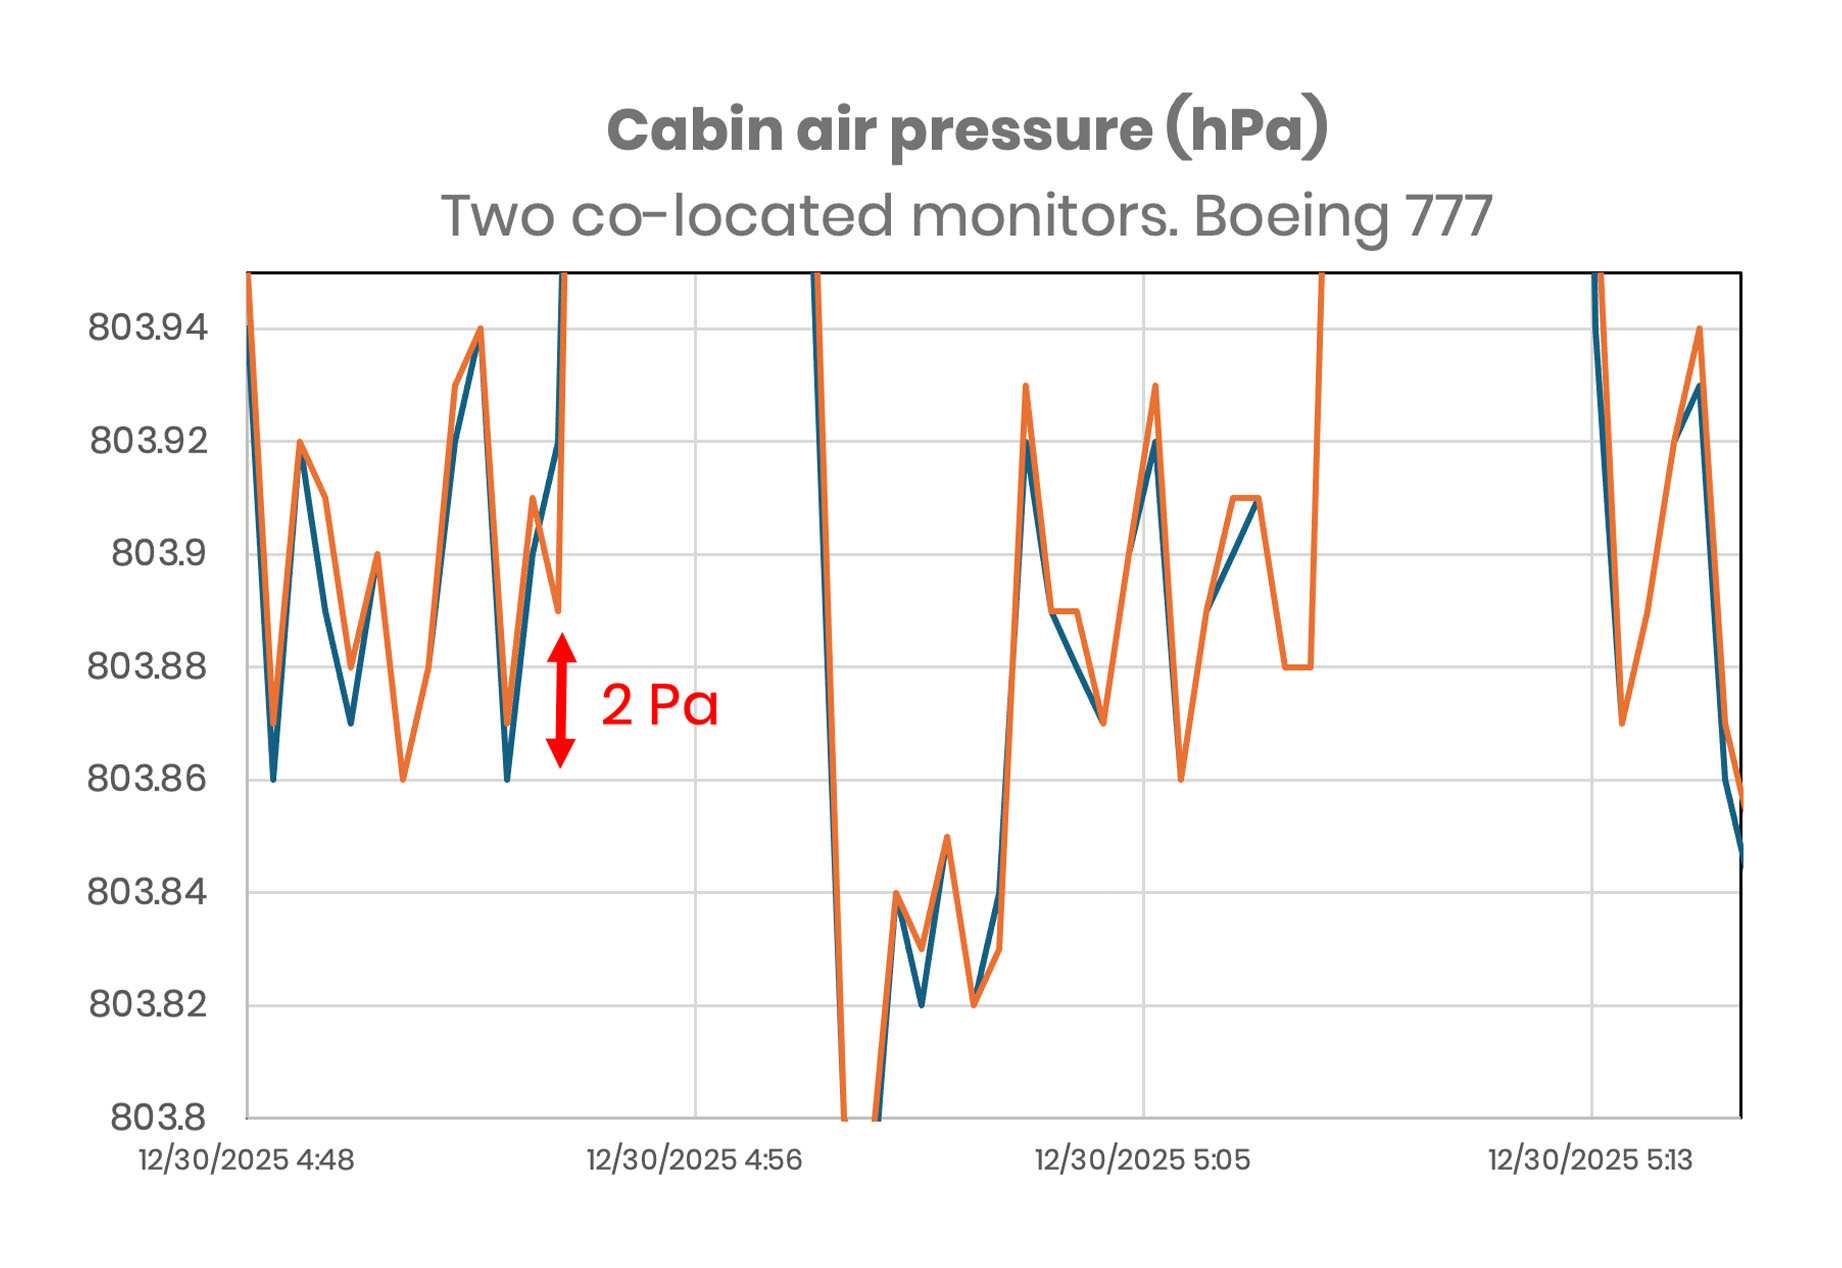
The repeatability fo the two IEQ Monitors at 800 hPA, far from the calibration point of 1000 hPa, was impressive: the pressure sensors in the IEQ Monitor remained accurate and precise, even at the extreme of their pressure range.
Cabin temperature and humidity
Cabin temperature appears to be reasonably controlled. We see a slight increase in cabin temperature during the flight – it is often commented that the crew turn up the temperature on long flights to encourage sleep.
Humidity is regulated at 10% to 15% RH, very low. This saves energy, but please use moisturiser!